


Gold Price Talking Points:
- There are few indications that the US-China trade war is going to end any time soon, and as a result, traders are flocking into more risk-averse positions as volatility continues to push higher.
- While other asset classes don’t like increased volatility, precious metals tend to benefit as heightened uncertainty increases the appeal of gold’s and silver’s safe haven appeal. To this end, if GVZ pushes to a fresh yearly high, it is likely that gold prices follow: the 5-day correlation between GVZ and gold prices is 0.85; and the 20-day correlation is 0.83.
- Retail trader positioning suggests that the gold price rally may be set to continue soon.
Looking for longer-term forecasts on Gold and Silver prices? Check out the DailyFX Trading Guides.
There are few indications that the US-China trade war is going to end any time soon, and as a result, traders are flocking into more risk-averse positions as volatility continues to push higher. Global equity markets are under pressure as emerging market pains shift from the Chinese Yuan to the Argentinian Peso. In turn, the low yielding safe havens like the Japanese Yen and Swiss Franc are outperforming at the start of the week.
Meanwhile, US Treasury yields continue to drop while the German Bund yield curve falls deeper into negative territory, undergirding an environment defined by falling real sovereign bond yields. As it were, falling real yields tend to benefit gold and silver prices; the fundamental case for more gains by precious metals remains strong.
Gold Volatility Pushes Higher as US-China Trade War Deepens
Gold volatility (as measured by the Cboe’s gold volatility ETF, GVZ, which tracks the 1-month implied volatility of gold as derived from the GLD option chain) continues to maintain its elevation after its recent swing higher. Since setting a fresh eight-week low on July 31 at 9.97, GVZ is back at 17.69.
GVZ (Gold Volatility) Technical Analysis: Daily Price Chart (November 2016 to August 2019) (Chart 1)

While other asset classes don’t like increased volatility (signaling greater uncertainty around cash flows, dividends, coupon payments, etc.), precious metals tend to benefit from periods of higher volatility as uncertainty increases the gold’s and silver’s safe haven appeal. To this end, if GVZ pushes to a fresh yearly high, it is likely that gold prices follow: the 5-day correlation between GVZ and gold prices is 0.85; and the 20-day correlation is 0.83.
GOLD PRICE TECHNICAL ANALYSIS: WEEKLY CHART (AUGUST 2011 TO AUGUST 2019) (CHART 2)

Gold prices continue to advance in the context of a multi-year inverse head and shoulders pattern. As previously noted, “The placement of the neckline determines the final upside targets in a potential long-term gold price rally: conservatively, drawing the neckline breakout against the January 2018 high at 1365.95; aggressively, drawing the neckline breakout against the August 2013 high at 1433.61 calls for a final target at 1820.99.”
The longer-term bullish perspective remains valid. With gold prices holding above the weekly 13-EMA – the one-quarter moving average – and both weekly MACD and Slow Stochastics trending higher, bullish momentum remains strong.
Gold Price Technical Analysis: Daily Chart (AUGUST 2018 to AUGUST 2019) (Chart 3)

In our last update, it was noted that “with the consolidation over the past six-weeks carving out a sideways range between 1381.62 and 1452.80, the near-time measured move for the bullish breakout comes in at 1523.98.”
Gold prices were able to breakout above 1452.80, triggering the ascent towards the range’s measured move at 1523.98; at the time this report was written, gold was trading at 1504.67. With gold prices still comfortably above the daily 8-, 13-, and 21-EMA envelope, Slow Stochastics holding in overbought conditions, and daily MACD trending higher in bullish territory, the path of least resistance continues to be to the topside.
Gold Price Technical Analysis: 4-hour Chart (AUGUST 2018 to AUGUST 2019) (Chart 3)
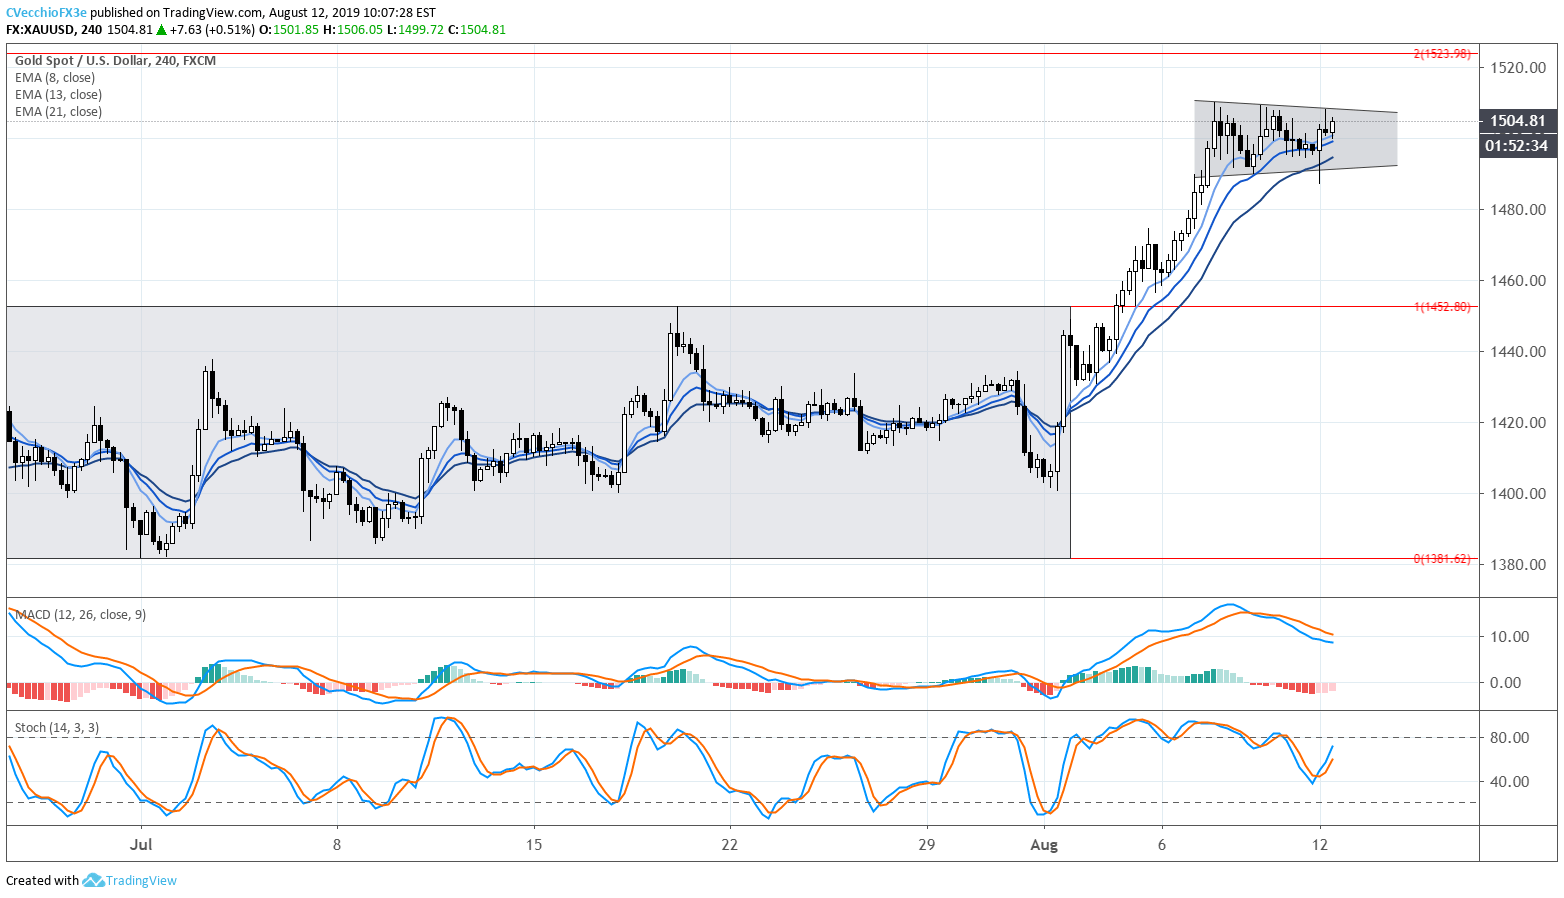
A closer look at a short-term timeframe highlights the scope of the pause in the gold price rally over recent days. A sideways consolidation has formed, appearing to be in the form of a bull flag or pennant. The measured move to the topside out of the formation calls for a move up towards 1540; in turn, this would achieve the measured move out of the six-week consolidation at 1523.98.
IG Client Sentiment Index: Spot Gold Price Forecast (August 12, 2019) (Chart 4)
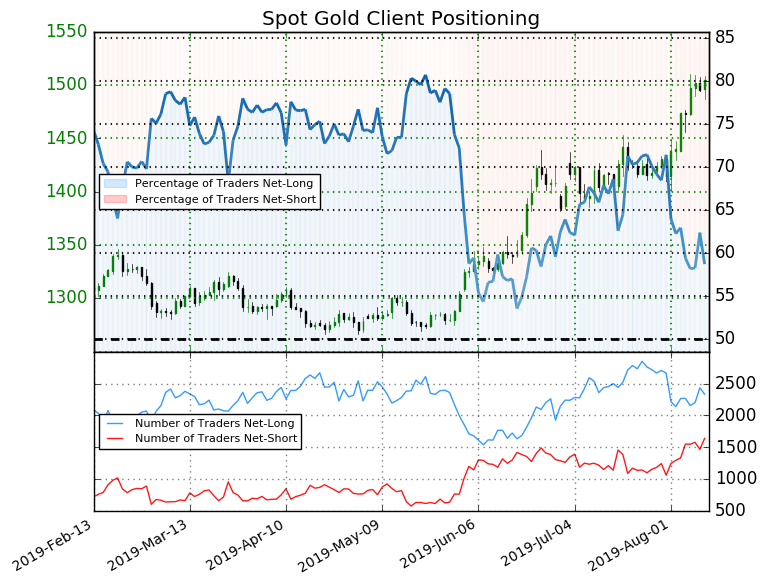
Spot gold: Retail trader data shows 58.7% of traders are net-long with the ratio of traders long to short at 1.42 to 1. The number of traders net-long is 1.6% lower than yesterday and 3.0% lower from last week, while the number of traders net-short is 6.4% higher than yesterday and 19.8% higher from last week.
We typically take a contrarian view to crowd sentiment, and the fact traders are net-long suggests Spot Gold prices may continue to fall. Yet traders are less net-long than yesterday and compared with last week. Recent changes in sentiment warn that the current spot gold price trend may soon reverse higher despite the fact traders remain net-long.
FX TRADING RESOURCES
Whether you are a new or experienced trader, DailyFX has multiple resources available to help you: an indicator for monitoring trader sentiment; quarterly trading forecasts; analytical and educational webinars held daily; trading guides to help you improve trading performance, and even one for those who are new to FX trading.
--- Written by Christopher Vecchio, CFA, Senior Currency Strategist
To contact Christopher Vecchio, e-mail at cvecchio@dailyfx.com
Follow him on Twitter at @CVecchioFX
View our long-term forecasts with the DailyFX Trading Guides


