


Gold Price Talking Points:
- With the US Dollar and US Treasury yields falling together thanks to the latest developments in the US-China trade war, gold and silver prices are shining.
- The rise in gold volatility, as measured by the Cboe’s ETF, GVZ (which tracks the 1-month implied volatility of gold as derived from the GLD ETF option chain) is undergirding the recent breakout in gold prices.
- Retail trader positioning confirms that the gold price rally has resumed.
Looking for longer-term forecasts on Gold and Silver prices? Check out the DailyFX Trading Guides.
There is a straight line between the US-China trade war, Fed rate cut expectations, and gold prices. As a measure of uncertainty, gold volatility’s recent moves in July can be traced back to the uncertainty created by the US-China trade war and the resulting impact on Fed interest rates. As Fed rate cut odds have increased in the past few days, we’ve seen both the US Dollar (via DXY Index) and US Treasury yields drop sharply: falling real US yields remain a formidable source of support for gold prices.
Gold Volatility Goes Up as Chinese Yuan Goes Down, Fed Rate Cut Odds Soar
After the July Fed meeting, there was a 9% chance of a 25-bps rate cut at the September Fed meeting; now, there is a 100% chance of at least a 25-bps rate cut and a 34% chance of a 50-bps rate cut. These dramatic, volatile shifts in Fed rate cut pricing are helping breed volatility across asset classes, including gold.
While other asset classes don’t like increased volatility (signaling greater uncertainty around cash flows, dividends, coupon payments, etc.), precious metals tend to benefit from periods of higher volatility as uncertainty increases the appeal of gold’s and silver’s safe haven appeal.
GVZ (Gold Volatility) Technical Analysis: Daily Price Chart (October 2016 to August 2019) (Chart 1)
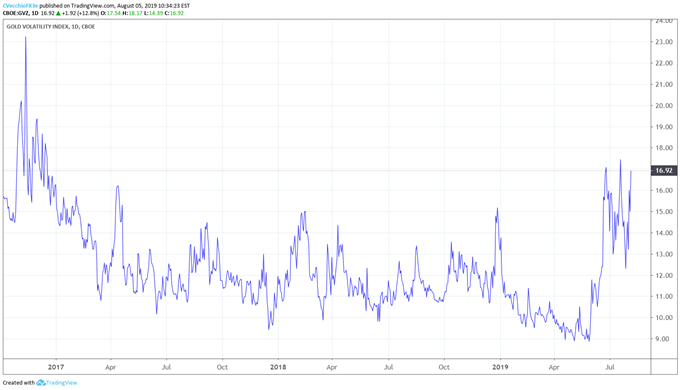
Gold volatility (as measured by the Cboe’s gold volatility ETF, GVZ, which tracks the 1-month implied volatility of gold as derived from the GLD option chain) set a fresh eight-week low on July 31 at 9.97 before surging back to 16.92 today. Gold volatility has undergirded the recent surge in gold prices: the 5-day correlation between spot gold and GVZ is up from 0.32 on July 29 to 0.98 today; and the 20-day correlation is up from 0.56 on July 29 to 0.74 today.
GOLD PRICE TECHNICAL ANALYSIS: WEEKLY CHART (AUGUST 2011 TO AUGUST 2019) (CHART 2)
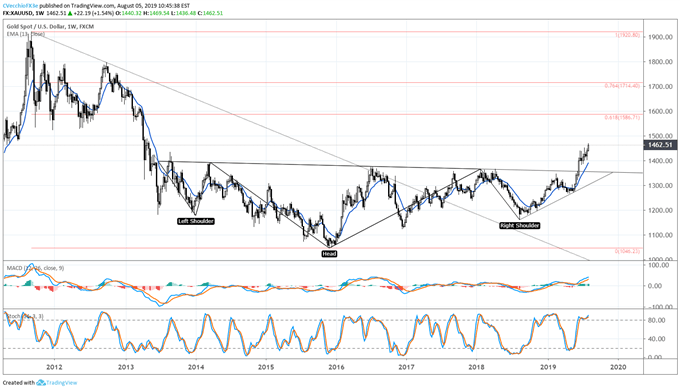
At the end of June, as gold prices were n the process of breaking out to fresh yearly highs, we suggested that the rally was but a smaller piece of a larger puzzle: this marked the continuation of a major bottoming effort that began in 2017, after breaking the multi-year descending trendline from the 2011 high. To this end, we posited that a multi-year inverse head and shoulders pattern was starting to form.
“The placement of the neckline determines the final upside targets in a potential long-term gold price rally: conservatively, drawing the neckline breakout against the January 2018 high at 1365.95; aggressively, drawing the neckline breakout against the August 2013 high at 1433.61 calls for a final target at 1820.99.”
Since the end of June, gold price action has not done anything to invalidate our longer-term bullish perspective. With gold prices holding above the weekly 13-EMA – the one-quarter moving average – and both weekly MACD and Slow Stochastics trending higher, momentum remains on the up and up.
Gold Price Technical Analysis: Daily Chart (AUGUST 2018 to AUGUST 2019) (Chart 3)
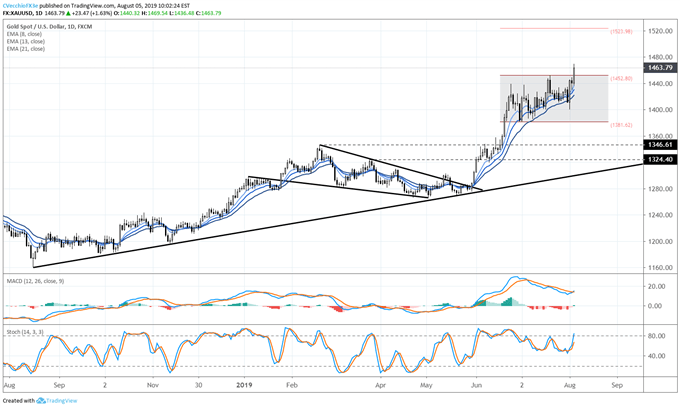
In our last update, it was noted that “it would appear that the path of least resistance remains higher…new highs may be coming soon.” Having achieved the 100% Fibonacci extension at 1452.72 (August 2018 low to February 2019 high, retraced to the May 2019 low) in mid-July, gold prices had been meandering around.
But with the latest news in the US-China trade war culminating in a sharp depreciation by the Chinese Yuan and a plunge in US Treasury yields, gold price action has been bolstered by the emergence of two key themes: concerns about global growth; and in turn, the reaction function by the Federal Reserve (lower interest rates).
Now, gold prices have been able to clear out the former yearly high and bearish key reversal set on July 19, clearing the way for another rally to fresh highs. Gold prices are comfortably above the daily 8-, 13-, and 21-EMA envelope, while Slow Stochastics have surged back to overbought conditions and daily MACD has just issued a buy signal in bullish territory.
With the consolidation over the past six-weeks carving out a sideways range between 1381.62 and 1452.80, the near-time measured move for the bullish breakout comes in at 1523.98.
IG Client Sentiment Index: Spot Gold Price Forecast (August 5, 2019) (Chart 3)
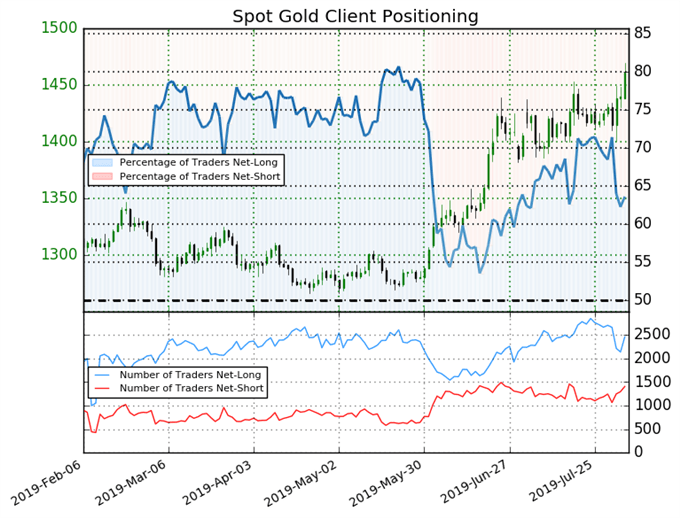
Spot gold: Retail trader data shows 63.6% of traders are net-long with the ratio of traders long to short at 1.75 to 1. The number of traders net-long is 9.2% higher than yesterday and 12.9% lower from last week, while the number of traders net-short is 7.6% higher than yesterday and 14.1% higher from last week.
We typically take a contrarian view to crowd sentiment, and the fact traders are net-long suggests spot gold prices may continue to fall. Traders are further net-long than yesterday and last week, and the combination of current sentiment and recent changes gives us a stronger spot gold-bearish contrarian trading bias.
FX TRADING RESOURCES
Whether you are a new or experienced trader, DailyFX has multiple resources available to help you: an indicator for monitoring trader sentiment; quarterly trading forecasts; analytical and educational webinars held daily; trading guides to help you improve trading performance, and even one for those who are new to FX trading.
--- Written by Christopher Vecchio, CFA, Senior Currency Strategist
To contact Christopher Vecchio, e-mail at cvecchio@dailyfx.com
Follow him on Twitter at @CVecchioFX
View our long-term forecasts with the DailyFX Trading Guides


