


Talking Points
- The DXY Index rally hasn’t been insignificant, with the bearish outside engulfing bar set on the January FOMC meeting day broken to the topside.
- However, the US Dollar remains in the confines of a symmetrical triangle since the start of the year, suggesting that more sideways chop is due.
- Gold’s rally cooled off the past week, but that was expected given technical observations regarding the nature of price and moving averages since the bottoming effort began last fall.
Looking for longer-term forecasts on the US Dollar? Check out the DailyFX Trading Guides.
The US Dollar (via the DXY Index) has seen its rally continue into a fifth day on Wednesday, fueled by growing concerns overseas about slowing economic growth. Dovish commentary by Reserve Bank of Australian Governor Philip Lowe has weighed on the Australian Dollar, which in turn is having a knock-on effect to the rest of the commodity currency complex. Coming into this week, there was a 35% chance of a 25-bps rate cut by the RBA by the end of 2019; at the time of writing, overnight index swaps were pricing those odds at 61%.
The commentary by RBA Governor Lowe is being taken in context of the US-China trade war, naturally. With Australia’s two largest trading partners hunkered down in a war of economic attrition, the Australian economy may be seen as a bellwether – the canary in the coal mine, if you will – for whether or not the US-China trade war is having more than just a short-term, passing impact. Evidence is certainly mounting that as the trade war drags on, both business and consumer confidence in developed economies are starting to slip.
Elsewhere, another wave of soft German economic data has put more downside pressure on the Euro. The simple reality is that the ECB’s recent declaration that “more monetary evidence is necessary” before another stimulus effort could be undertaken is proving frail, insofar as we’ve seen nothing but disappointing Eurozone economic data since policymakers met on January 24. With the Euro constituting 57.6% of the DXY Index, it’s no surprise that the US Dollar is staying elevated. The observation from last week, that “the US Dollar was ‘the best house in a bad neighborhood,’ it may be the case that the FX market is simply a ‘bad neighborhood’ at this point in time. Traders should anticipate more volatility,” still holds true.
Gold Price Chart: Daily Timeframe (December 2017 to February 2019) (Chart 1)
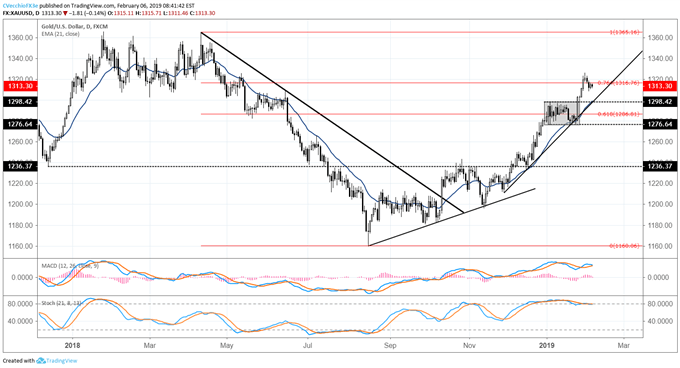
When we last checked in on Gold prices, we said that “Gold’s rally may be getting a bit too frothy in the short-term.” Our argument was that prices were far too extended from key moving averages: “Since the bottoming effort in Gold began at the end of Q3’18, there have been three instances in which Gold prices have peaked in excess of +2% higher than its daily 21-EMA: October 3, 2018; January 3, 2019; and today. Taking into account the extremely small sample size, the one-week returns for Gold after price moved in excess of +2% of the daily 21-EMA were +0.12% and -0.59%.”
Since the close last Wednesday, Gold has slumped by -0.59%. So, despite the small sample size since the bottoming effort began last fall, it still holds that the nature of the Gold rally remains consistent. In my opinion, it’s of little doubt that the fundamental backdrop for Gold has only firmed up over the past several months. As said last week, “If Gold’s rally pauses over the next few days, by no means does that mean that it is over; in fact, it may be a welcomed reprieve now that prices have been overextended to a certain degree.”
Indeed, Gold could trade sideways from now until February 18 and maintain both the uptrend from the November 28 and December 14 swing lows as well as the daily 21-EMA. By no means is the Gold uptrend finished; it’s just taking a breather.
DXY Index Price Chart: Daily Timeframe (June 2018 to February 2019) (Chart 2)

The rally by the DXY Index the past few days hasn’t been insignificant; the bearish outside engulfing bar established on the day of the January FOMC meeting has been broken. But given the benefit of hindsight, it now appears that price action at the start of 2019 has been producing a symmetrical triangle following the break of the April, September, and December 2018 uptrend. Such a consolidative pattern dictates patience by traders, as well as an open mind to resolutions on either side of the triangle.
It should be noted that the DXY Index’s rally has come alongside a pause in Gold’s efforts to push higher. Accordingly, if there is going to be a confirmed break higher by the DXY Index, it would need to go hand-in-hand with a breakdown in Gold prices back below their daily 21-EMA. Otherwise, for the time being, there is little reason to think that the current consolidative symmetrical triangle will resolve one way or the other. Near-term resistance comes into play near 96.45/50 for the remainder of the week, while support is near 95.20.
Read more: FX Week Ahead: RBA & BOE Rate Decision; Canadian & New Zealand Jobs
FX TRADING RESOURCES
Whether you are a new or experienced trader, DailyFX has multiple resources available to help you: an indicator for monitoring trader sentiment; quarterly trading forecasts; analytical and educational webinars held daily; trading guides to help you improve trading performance, and even one for those who are new to FX trading.
--- Written by Christopher Vecchio, CFA, Senior Currency Strategist
To contact Christopher Vecchio, e-mail at cvecchio@dailyfx.com
Follow him on Twitter at @CVecchioFX
View our long-term forecasts with the DailyFX Trading Guides


