


Talking Points:
- Fed funds now implying Fed would first hike in July.
- US Dollar struggles as risk appetite improves broadly.
- Higher volatility in FX markets should have implications for your trading strategies.
The US Dollar, which had been on a tear through May, recently hit a wall. After a string of improved US economic data and optimistic, hawkish Fed speakers talked up the chances of multiple rate hikes this year, market participants finally stopped offering the greenback lower at the start of this month.
Just last Wednesday, the April FOMC minutes itself confirmed this notion, making clear a rate hike in June is possible. The US Dollar, which had been rallying previously, saw price extend to fresh monthly highs just short of 11980, converging with rate expectations for a June hike around 36%.
It seems that the USDOLLAR Index and market expectations for a Fed hike are once again intertwined. Over the past week, the odds of a June hike have subsided marginally to 34% (see table below), and in turn, the USDOLLAR Index has crept back below its closing level (11950) after last Wednesday's April FOMC minutes release.
Table 1: Probability of Rate Hikes across Upcoming Fed Meetings
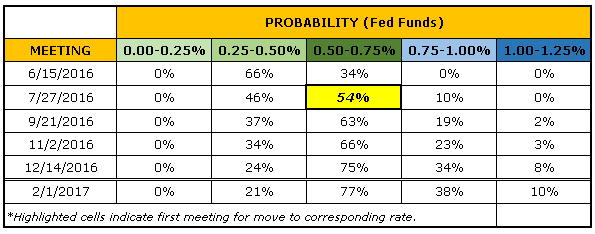
Traders may have 'taken the hint' that the April FOMC minutes made clear: market expectations for a June hike "might be unduly low." Noted - and now the market seems to be in compliance.
Nevertheless, with rate expectations for June stalling, traders seem to need more evidence before committing to the idea that the Fed will raise rates next month. Markets are now pricing in July as the most likely period for the first rate hike, with the odds of a hike having jumped to 54%. Correlation is not causation, but the Fed has not raised rates unless market participants have priced in at least a 60% chance in the front month of them doing so. By this logic, September remains the "most likely" period for action, at least by the market's POV.
Moreover, considering that July is a month without new economic projections, we're highly doubtful that the Fed would suddenly hike rates without having data in hand and/or a podium for Chair Janet Yellen to speak from to try and soothe the masses thereafter (which is the case at each meeting when the new economic projections are released).
The USDOLLAR Index has sagged without the continued rise in June rate hike expectations, even as the market has pulled forward the likelihood of action in July or September. This poses a problem, as the USDOLLAR Index has been trying to breakout of the downtrend governed by the January and February 2016 highs (chart below).
Chart 1: USDOLLAR Index Daily Chart (November 2015 to May 2016)
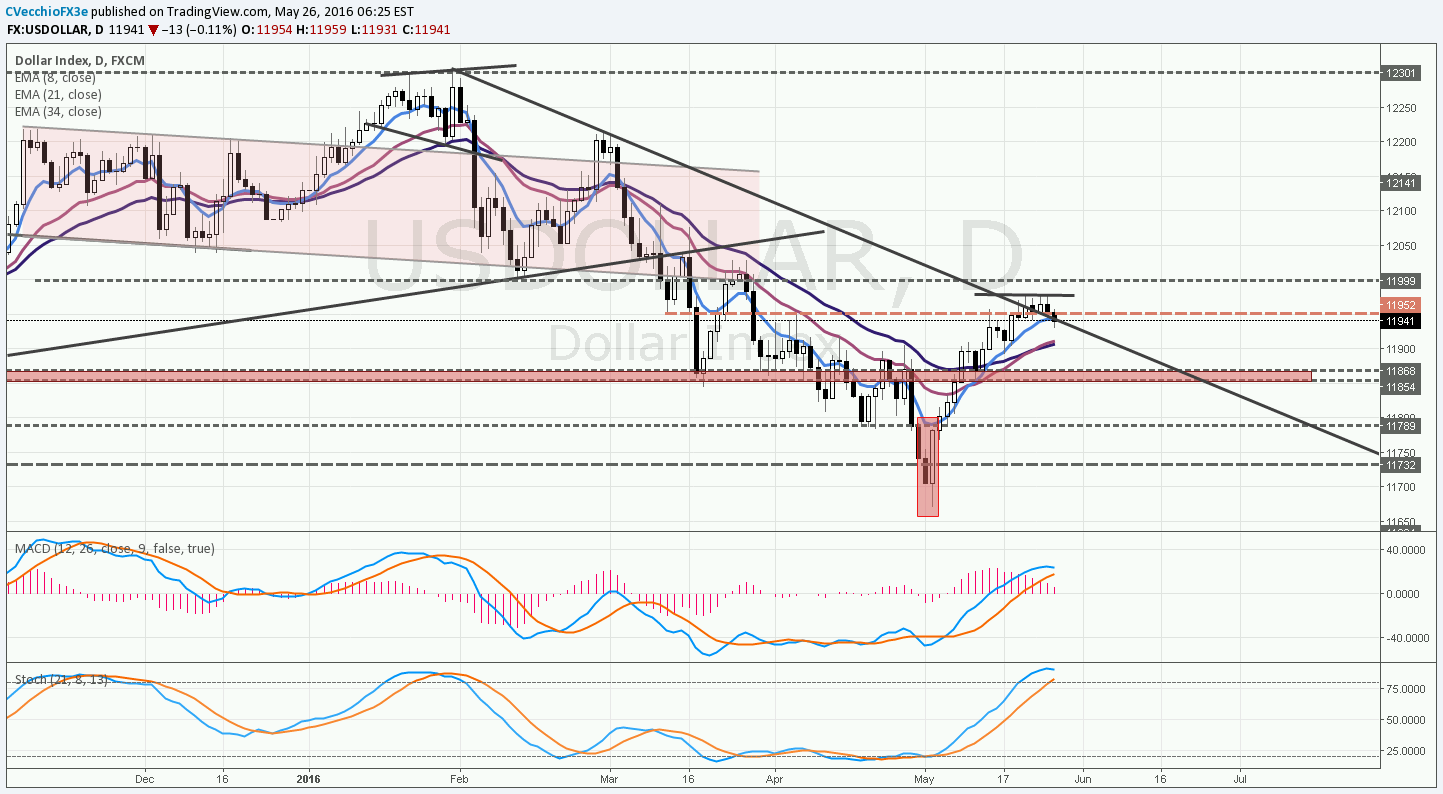
In the short-term, it's important that the USDOLLAR Index holds above its daily 8-EMA on a closing basis, which it's trading back to a present time. Price hasn't closed below the daily 8-EMA since May 4, and a breach of this trend would offer good reason for pause to any near-term bullish forecast.
The daily MACD and Stochastics indicators are in bullish territory but losing their upside bias more quickly these past few days, suggesting momentum is starting to cool. Failure below the daily 8-EMA would draw attention to the 11910/20 region below, where price had previously carved out a number of intramonth highs during April.
If the USDOLLAR Index does return to the topside, look no further than EUR/USD to be front and center, given the pair's thinnest net-short positioning in about two years. Likewise, the pair is currently trading back to trendline support from the December 2015 and March 2016 lows as its daily MACD and Stochastics break into their bearish territory (chart below).
Chart 2: EUR/USD Daily Chart (January 2015 to May 2016)

The next few days could be key for EUR/USD - especially as we finish out the most bullish month of the year for the US Dollar (on a twenty year seasonality basis).
Read more: Positive News Flow Past 24-hours Boosts Risk, Holds Back US Dollar
If you haven't yet, read the Q2'16 Euro Forecast, "EUR/USD Stuck in No-Man’s Land Headed into Q2’16; Don’t Discount ’Brexit’," as well as the rest of all of DailyFX's Q2'16 quarterly forecasts.
--- Written by Christopher Vecchio, Currency Strategist
To contact Christopher Vecchio, e-mail cvecchio@dailyfx.com
Follow him on Twitter at @CVecchioFX
To be added to Christopher's e-mail distribution list, please fill out this form


