


Mexican Peso Technical Price Outlook: USD/MXN Near-term Trade Levels
- Mexican Peso updated technical trade levels – Daily & Intraday Charts
- USD/MXN carves weekly range below September open / trendline resistance
- Risk for topside exhaustion sub-21.5757– key near-term support 21.2316
The US Dollar is showing signs of life early in the week as the recent Mexican Peso assault relents. USD/MXN is up 0.60% into the open with price responding to monthly open resistance today in New York- the immediate focus is on a break of the weekly opening-range which has taken shape just below. These are the updated targets and invalidation levels that matter on the USD/MXN technical price charts.
{WEBINAR|855292659|Live Weekly Strategy Webinars on Mondays at 12:30GMT}}
Mexican Peso Price Chart – USD/MXN Daily

Chart Prepared by Michael Boutros, Technical Strategist; USD/MXN on Tradingview
Technical Outlook: In my last Mexican Peso Price Outlook we noted that, USD/MXN was, “in a near-term consolidation just below multi-month slope resistance– the immediate focus is on a break of the monthly opening-range for guidance.” The August range resolved lower late in the month with price dropping more than 4% into the 100% Fibonacci ext at 21.5307. A rebound off this thresholds failed today at confluence resistance at the April trendline / September open at 21.8779. Once again, the immediate focus is on a break of this near-term range for guidance with our broader bearish invalidation level now lowered to the 61.8% retracement at 22.5757.
Mexican Peso Price Chart – USD/MXN 120min
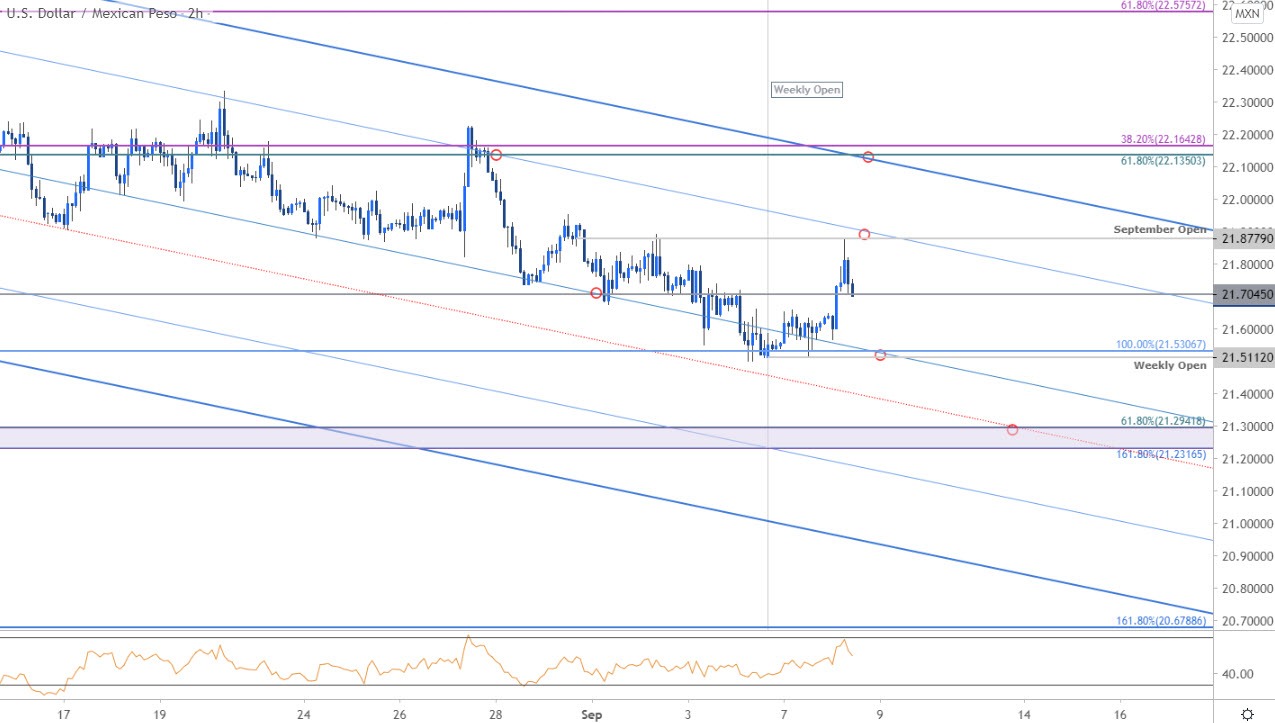
Notes: A closer look at Peso price action shows USD/MXN trading within the confines of an descending pitchfork formation extending off the August high and keeps the focus lower while below confluence Fibonacci/slope resistance at 22 0.1350/1642. Weekly open support rests at 21.5112 with a break/close below key support at 21.2316/2942 needed to mark resumption of the broader downtrend towards the lower parallels / 1.618% extension at 20.6789- look for a more significant reaction there if reached with subsequent objectives eyed at the 78.6% retracement at 20.0752.

Bottom line: USD/MXN has set its weekly opening range just below the objective September open. From a trading standpoint, look for topside exhaustion ahead of 22.1643 IF price is indeed heading lower with a close below 21.2316 needed to fuel the next leg in this trend. Ultimately, a close above 22.5757 would be required to shift the broader focus back to the long side of USD/MXN.
For a complete breakdown of Michael’s trading strategy, review his Foundations of Technical Analysis series on Building a Trading Strategy
---
Key US / Mexico Data Releases
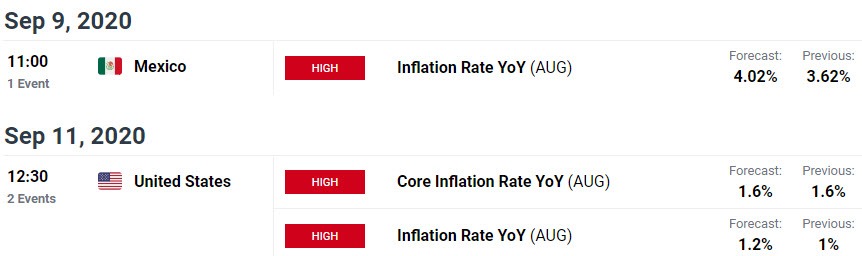
Economic Calendar - latest economic developments and upcoming event risk.
Active Technical Setups
- Sterling Technical Outlook: Cable Crush After Key Resistance Test?
- Canadian Dollar Outlook: USD/CAD Coils– Loonie Breakout Imminent
- Japanese Yen Technical Outlook: USD/JPY Slams into August Range Lows
- Australian Dollar Forecast: AUD/USD Seven-Week Rally at Risk
- Gold Price Outlook: XAU/USD Crashes – Reversal or Retracement?
--- Written by Michael Boutros, Technical Strategist with DailyFX
Follow Michael on Twitter @MBForex


