


- A look at the weekly technicals for USD/JPY heading into FOMC / BoJ next week
- Check out our 2018 USD/JPY projections in our Free DailyFX Trading Forecasts
- Join Michael for Live Weekly Strategy Webinars on Mondays at 12:30GMT
In this series we scale-back and take a look at the broader technical picture to gain a bit more perspective on where we are in trend. Here are the key levels that matter on the weekly chart for the US Dollar vs the Japanese Yen (USD/JPY).
New to Forex Trading? Get started with this Free Beginners Guide
USD/JPY Weekly Price Chart
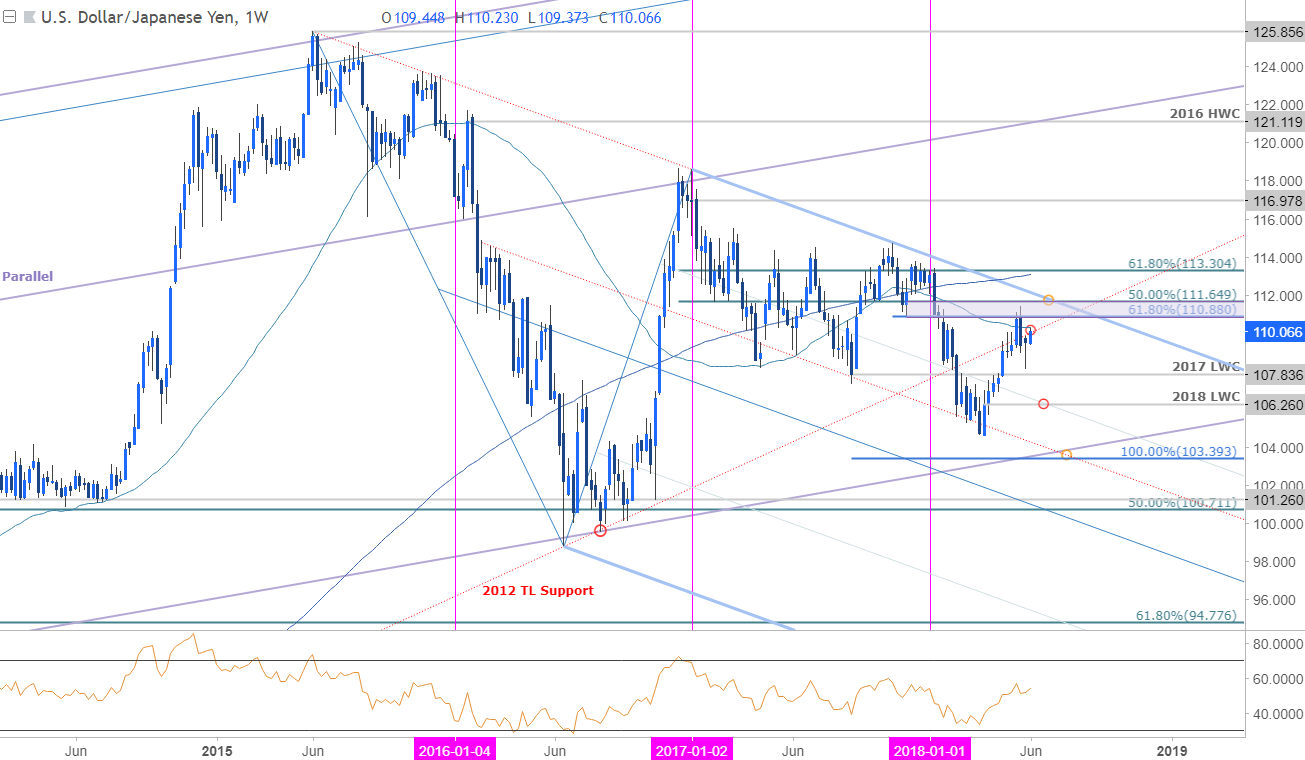
Notes: USD/JPY posted an outside-weekly reversal off a key resistance range last month at 110.88-111.65 (bearish). The reversal marked the end of an eight-week rally in prices- in past instances of such an occurrence (9/2014 & 12/2013), the rally stalled out for at least a few weeks (shallow corrections), if not longer, before resuming higher. Note that slope resistance extending off the 2015 highs converges on this resistance zone over the next few weeks and may limit further advances in the medium-term. The momentum profile also suggests the advance may be vulnerable here with weekly RSI holding below the 60-threshold (sub-60 since early 2017).
Initial weekly support rests at 107.84 backed by the yearly low-week close at 106.26. A topside breach / close above this resistance range would be needed to mark resumption with such a scenario targeting the 200-week moving average / 61.8% retracement at 113.00/30.
For a complete breakdown of Michael’s trading strategy, review his Foundations of Technical Analysis series on Building a Trading Strategy
Bottom line: The March rally in USD/JPY is testing its first major resistance hurdle here with the advance at risk in the medium-term while below 111.65. We can’t rule out another test of the highs but IF price is heading lower on this stretch, look for initial resistance at the 52-week / 200-day moving averages at ~110.15/30s. Keep in mind the FOMC & BoJ interest rate decisions are on tap next week.
USD/JPY IG Client Positioning

- A summary of IG Client Sentiment shows traders are net-long USD/JPY- the ratio stands at +1.12 (52.8% of traders are long) – weak bearishreading
- Retail has remained net-long since May 23rd ;price has moved 1.1% lower since then
- Long positions are 0.4% higher than yesterday and 12.3% higher from last week
- Short positions are 5.6% higher than yesterday and 9.0% higher from last week
- We typically take a contrarian view to crowd sentiment, and the fact traders are net-long suggests USD/JPY prices may continue to fall. However, retail traders are less net-long than yesterday but more net-long from last week andthe combination of current positioning& recent changes gives us a further mixed USD/JPY trading bias from a sentiment standpoint.
Why does the average trader lose? Avoid these Mistakes in your trading
Economic Calendar - latest economic developments and upcoming event risk
Previous Weekly Technical Perspectives
- Weekly Technical Perspective on Crude Oil Prices
- Weekly Technical Perspective on the British Pound (GBP/USD)
- Weekly Technical Perspective on the US Dollar
- Weekly Technical Perspective on AUD/USD
--- Written by Michael Boutros, Technical Currency Strategist with DailyFX
Follow Michael on Twitter @MBForex or contact him at mboutros@dailyfx.com


