


- A look at the weekly technicals for Crude Oil (USOil) heading into June trade
- Check out our 2018 Crude Oil projections in our Free DailyFX Trading Forecasts
- Join Michael for Live Weekly Strategy Webinars on Mondays at 12:30GMT
In this series we scale-back and take a look at the broader technical picture to gain a bit more perspective on where we are in trend. Here are the key levels that matter on the weekly charts for Crude Oil prices. Review this week’s Strategy Webinar for an in-depth breakdown of this setup and more.
New to Trading? Get started with this Free Beginners Guide
Crude Oil Weekly Price Chart
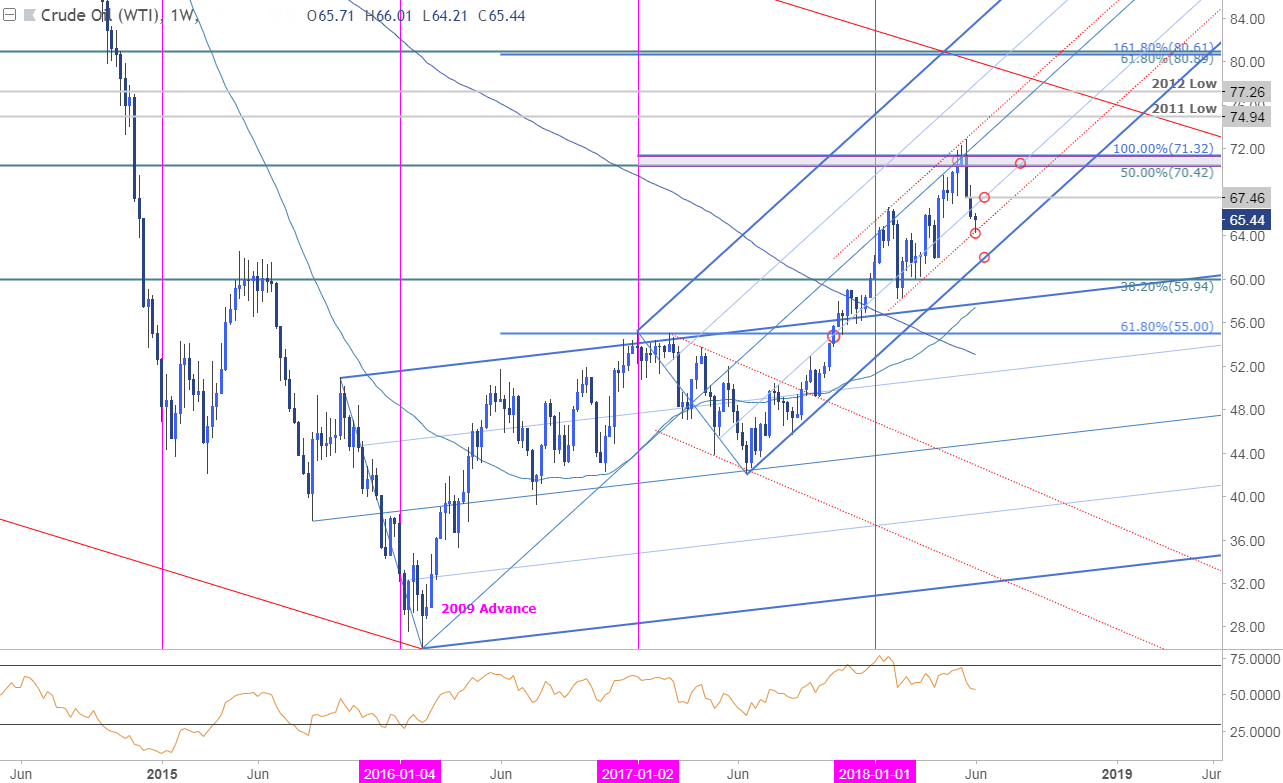
Notes:Last month we highlighted a key resistance zone in crude prices at, “70.42-71.32 where the 100% extension of the 2016 advance and the 50% retracement of the 2011 decline converge on the median-line.” Price registered a high-close at 71.33 before posting an outside weekly reversal off parallel resistance (on building RSI divergence).
Oil is down more than 10% off the yearly high at this point with prices testing parallel support today in New York trade. We’re likely to see some back-and-fill (recovery) here but the broader risk remains lower while below the yearly high-week close at 67.46. Ultimately a breach / close above the 70.42-71.32 resistance range would be needed to mark resumption of the broader uptrend.
For a complete breakdown of Michael’s trading strategy, review his Foundations of Technical Analysis series on Building a Trading Strategy
Crude Oil Weekly Price Chart (Analog)
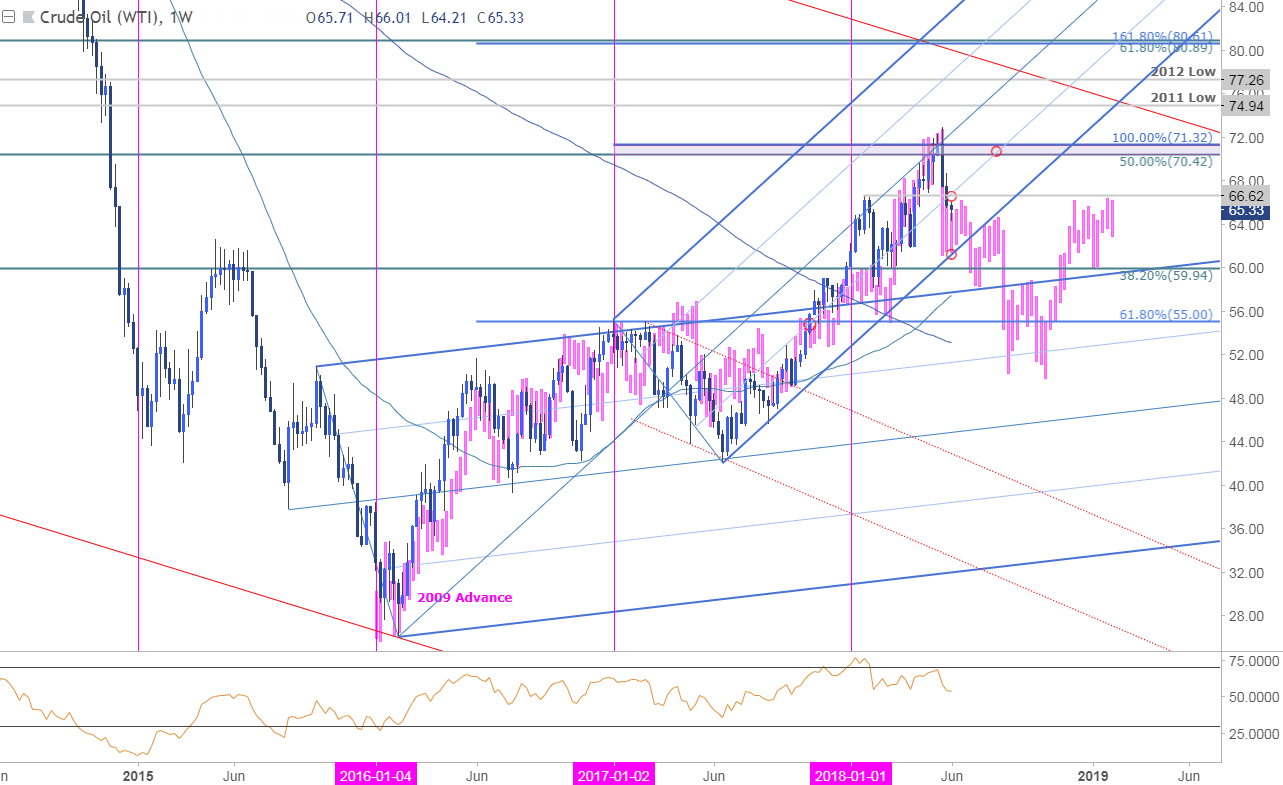
Bottom line: We’ve been tracking this price analog with the 2009 advance in crude oil since the start of the year. The analysis suggests sideways-to-lower price action over the next few weeks with a break lower from here targeting support objectives at the lower median-line parallel, currently around ~61.80s- look for a more prominent reaction there IF reached (area of interest for possible near-term exhaustion / long-entries). Keep in mind we get the release of crude oil inventories tomorrow at 2:30pm ET.
Crude Oil IG Client Positioning

- A summary of IG Client Sentiment shows traders are net-long the Crude Oil (USOil)- the ratio stands at +1.71 (63.1% of traders are long) – bearishreading
- Retail has remained net-long since May 25th ;price has moved 8.1% lower since then
- Long positions are 2.5% lower than yesterday and 11.7% higher from last week
- Short positions are 2.3% lower than yesterday and 1.5% higher from last week
- We typically take a contrarian view to crowd sentiment, and the fact traders are net-long suggests Oil - US Crude prices may continue to fall. However, retail traders are less net-long than yesterday but more net-long from last week and the combination of current positioning and recent changes gives us a further mixed Crude Oil trading bias from a sentiment standpoint.
Why does the average trader lose? Avoid these Mistakes in your trading
Economic Calendar - latest economic developments and upcoming event risk
Previous Weekly Technical Perspectives
- Weekly Technical Perspective on the British Pound (GBP/USD)
- Weekly Technical Perspective on the US Dollar
- Weekly Technical Perspective on AUD/USD
--- Written by Michael Boutros, Technical Currency Strategist with DailyFX
Follow Michael on Twitter @MBForex or contact him at mboutros@dailyfx.com


