


- A look at the weekly technicals on EURUSD, U.S. Bonds and Crude Oil
- Review Michael’s Foundations of Technical Analysis Series on Building a Trade Strategy
- Join Michael for Live Weekly Strategy Webinars on Mondays at 12:30GMT
In this series we scale-back and take a look at the broader technical picture to gain a bit more perspective on where price is trading with respect to trend. Here are the key technical levels that matter on the weekly charts heading into the weekend.
EUR/USD Weekly Chart

Notes: EUR/USD broke below confluence slope support last month with the decline breaking below the yearly opening range lows at 1.1916. Price is now approaching confluence support around 1.1709/45 where the 38.2% retracement of the late-2016 advance converges on a parallel of the dominant slope extending of the November low (red). Ultimately the outlook remains weighted to the downside while below the yearly open but IF Euro is going to rebound (at least in the short-term) this would be a good spot.
Bottom line: The immediate EUR/USD decline is at risk heading into the 1.17-handle. Initial resistance stands back at 1.1916 with a breach above the yearly open at 1.2005 needed to alleviate further downside pressure. That said, a break lower from here would target subsequent support objectives a 1.1616 where the 2016 high converges on the median-line. From a trading standpoint, this would be a good spot to reduce any short-exposure - we would need to see some convincing near-term price action before attempting a recovery play. Watch the weekly close.
EUR/USD IG Client Positioning

- A summary of IG Client Sentiment shows traders are net-long EURUSD- the ratio stands at +1.09 (52.2% of traders are long) – extremely weak bearishreading
- Retail has remained net-long since April 30th; price has moved 2.7% lower since then
- Long positions are 5.4% lower than yesterday and 4.1% lower from last week
- Short positions are 6.5% higher than yesterday and 8.8% higher from last week
- We typically take a contrarian view to crowd sentiment, and the fact traders are net-long suggests EURUSD prices may continue to fall. Yet traders are less net-long than yesterday and compared with last week and the recent changes in sentiment warn that the current EURUSD price trend may soon reverse higher despite the fact traders remain net-long.
Check out our New EUR/USD 2018 projectionsin our Free DailyFX Trading Forecasts
TNX Weekly Chart (10Yr Yields)

Notes: Yields on the 10-year are breaking through a critical resistance range we’ve been tracking for months at 3.00/04- a region defined by the 2013 high-day close / swing high and up-slope resistance. The breach validates the breakout of the multi-decade downtrend and keeps the focus higher while above this threshold. Subsequent topside objectives are eyed at 3.22 with a more significant confluence region seen at 3.32/35. Key support and bullish invalidation now raised to 2.83.
Bottom line: Don’t fight this- price has cleared big resistance with momentum still deep in overbought territory and this thing could stretch. We’ll be on the lookout for possible exhaustion on a stretch into the aforementioned resistance targets if reached.
New to Trading? Get started with this Free Beginners Guide
Crude Oil Weekly Chart
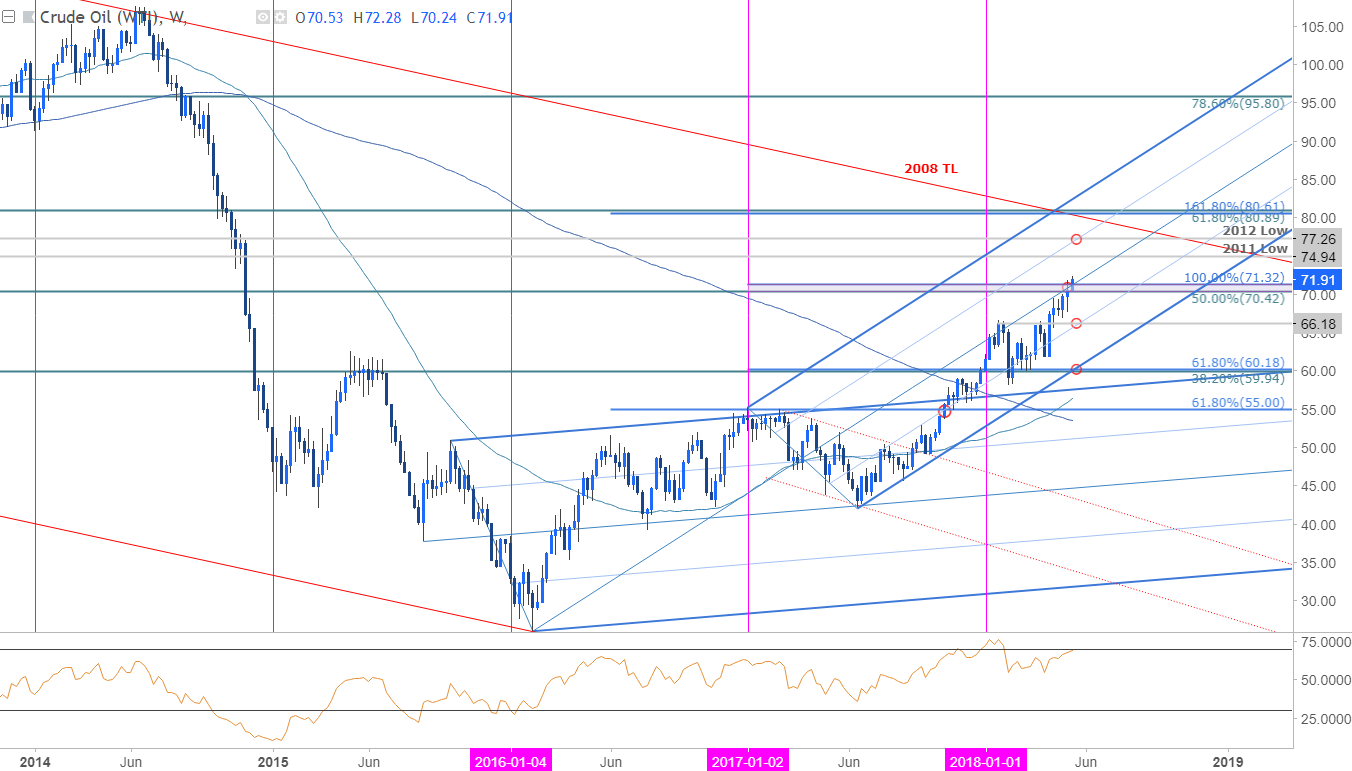
Notes: Crude oil prices are is testing a break of BIG resistance this week at 70.42-71.32 where the 100% extension of the 2016 advance and the 50% retracement of the 2011 decline converge on the median-line. This is either a false break, or things are about to get really interesting! It’s worth noting that we’ve been tracking a price analog with the 2009 advance which suggests that crude may be vulnerable for a rather sharp pullback here from a timing standpoint.
Bottom line: Again here the weekly close will be important- Interim support rests at 66.18 with broader bullish invalidation now raised to 59.94-60.18. A close above this key pivot (70.42-71.32) is needed to keep the immediate advance viable with such a scenario targeting the 2011 & 2012 lows at 74.94 and 77.26 respectively. From a trading standpoint, there’s nothing to do here yet if you’re not already long and it might be a good spot to start tightening up protective stops.
Why does the average trader lose? Avoid these Mistakes in your trading
Previous Weekly Technical Perspectives
- A Weekly Technical Perspective on GBP/USD, AUD/USD and U.S. Bonds
- Weekly Technical Perspective on NZD/USD, GBP/USD and EUR/NZD
- Weekly Technical Perspective on EUR/USD, AUD/USD and GBP/JPY
--- Written by Michael Boutros, Technical Currency Strategist with DailyFX
Follow Michael on Twitter @MBForex or contact him at mboutros@dailyfx.com


