


- A look at the weekly technicals on the US Dollar (DXY) heading into the close of the month
- Check out our 2018 projections in our Free DailyFX Trading Forecasts
- Join Michael for Live Weekly Strategy Webinars on Mondays at 12:30GMT
In this series we scale-back and take a look at the broader technical picture to gain a bit more perspective on where we are in trend. Here are the key levels that matter on the weekly charts for the US Dollar (DXY). Review this week’s Strategy Webinar for an in-depth breakdown of this setup and more.
New to Trading? Get started with this Free Beginners Guide
DXY Weekly Price Chart
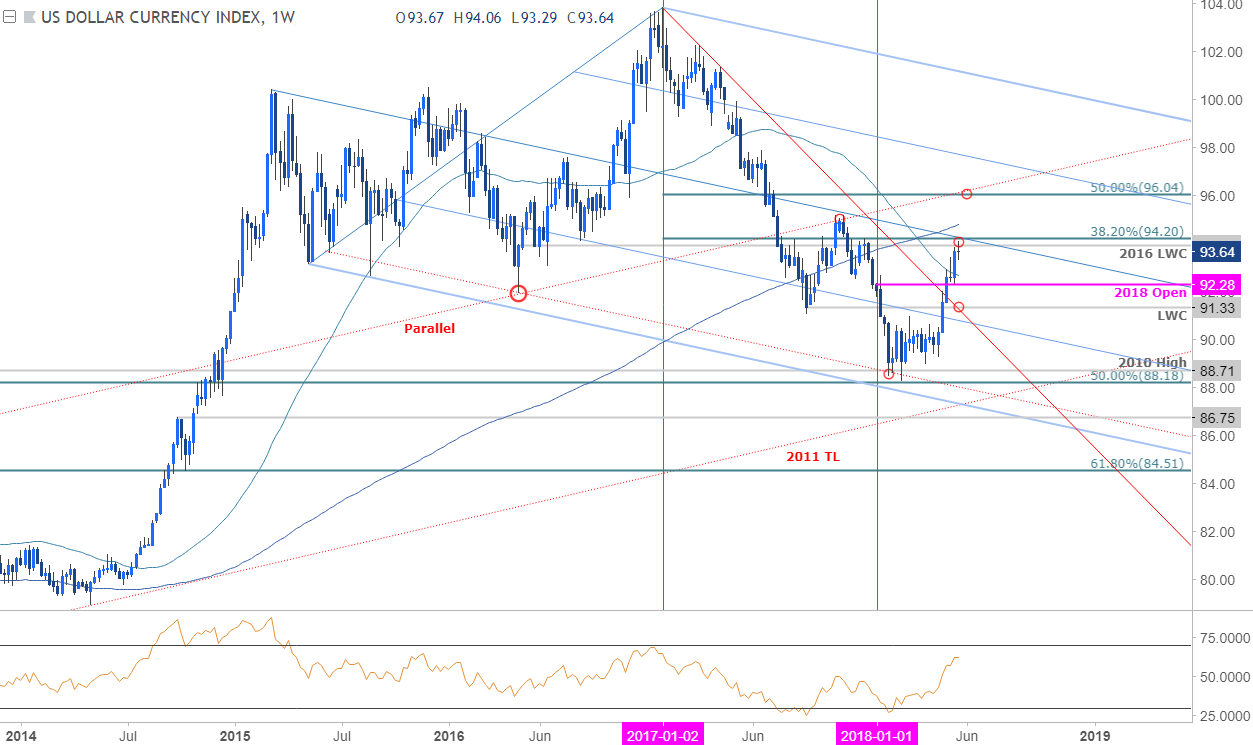
Notes: The US Dollar Index (DXY) has continued to trade within the confines of a broad descending pitchfork formation extending off the 2015 & 2017 swing highs with price registering the yearly lows at the lower parallels earlier this year. The subsequent rebound is testing confluence resistance this week at 93.89-94.20 where the 2016 low-week reversal close and the 38.2% retracement of the 2017 decline converge on the median-line.
For a complete breakdown of Michael’s trading strategy, review his Foundations of Technical Analysis series on Building a Trading Strategy
Bottom line: The broader long-bias remains at risk near-term while below this threshold. Interim support rests at 92.28 backed by bullish invalidation at 91.33 – both levels of interest for exhaustion / long-entries IF reached. A breach above this key zone targets subsequent resistance targets at the 200-week moving average at 94.80 and the 50% retracement at 96.04. With Euro accounting for nearly 60% of this index, we’ll be looking for near-term opportunities in EUR/USD as outlined in today’s EUR/USD Scalp Report.
Why does the average trader lose? Avoid these Mistakes in your trading
Previous Weekly Technical Perspectives
- Weekly Technical Perspective on AUD/USD
- Weekly Technical Perspective on EUR/USD, U.S. Bonds and Crude Oil
- Weekly Technical Perspective on GBP/USD, AUD/USD and U.S. Bonds
--- Written by Michael Boutros, Technical Currency Strategist with DailyFX
Follow Michael on Twitter @MBForex or contact him at mboutros@dailyfx.com


