


Talking Points
- S&P 500 breaks below monthly opening range- at risk for further losses sub-2365
- Updated targets & invalidation levels
- Looking for more trade ideas? Review DailyFX’s 2017 Trading Guides. Join Michael for Live Weekly Trading Webinars on Mondays at 13:30GMT (8:30ET)
S&P 500 Daily

Technical Outlook:The S&P 500 broke a near-term consolidation pattern this week with the decline taking out the monthly opening range lows & the monthly open. The index is responding to initial confluence support today and while we could see some more upside near-term, the risk remains lower while below resistance at 2365. Keep in mind an objective measured move of the triangle break targets critical support at 2307/15 – Know these two levels heading into next week with a break of this range likely to fuel the next Big move in equity markets.
S&P 500 240min
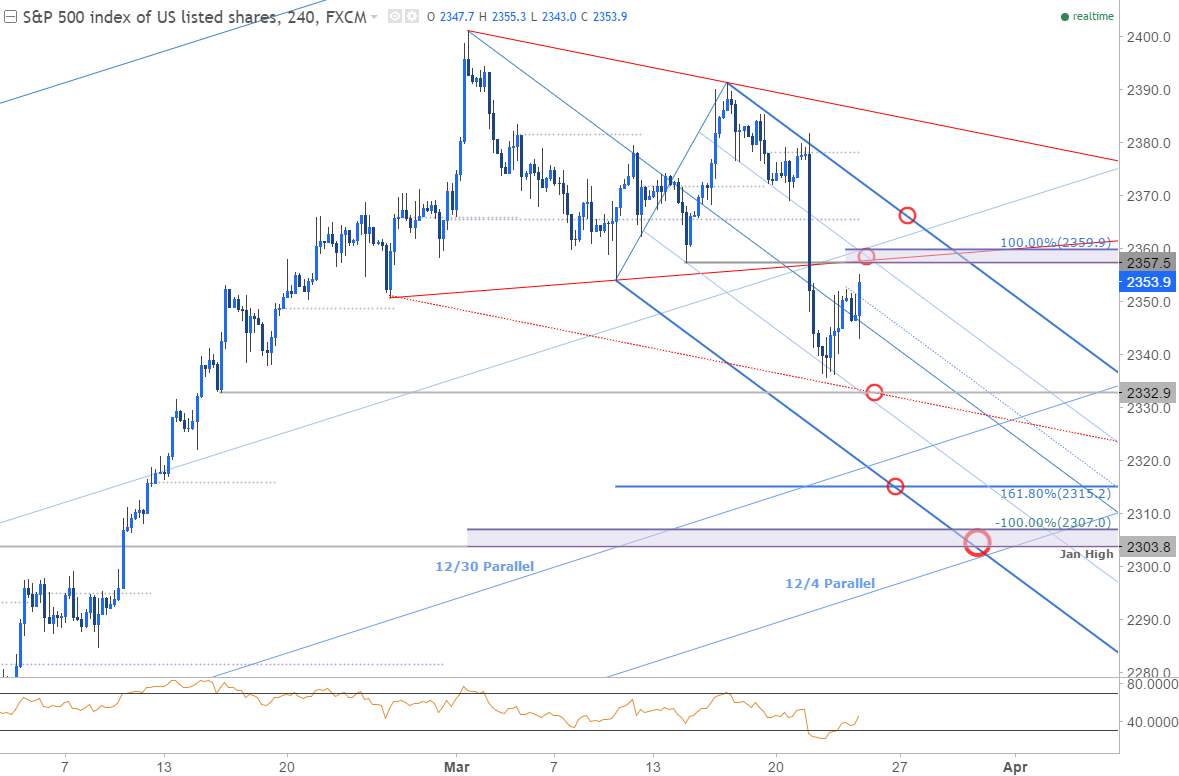
Notes: A closer look at price action highlights a near-term descending pitchfork formation extending off the highs. Interim resistance stands at 2357/59 where the 50-line converges on the 100% extension of the recent advance & the 3/14 swing low with our broader bearish invalidation set to the upper parallel / monthly open at 2365. A breach / close above this level would be needed to shift the focus back to the long-side with such scenario targeting basic trendline resistance, currently ~2384.
That said, a break below interim support at 2332 targets 2315 & 2303/07- both areas of interest for possible exhaustion / long-entries. From a trading stand point, I’ll be looking to fade strength / short-triggers into structural resistance with a break sub-2332 needed to mark a more meaningful correction. Keep in mind trying to call / time turns in markets is never easy- but being able to recognize when the conditions are right can offer plenty of near-term opportunities.

- A summary of the DailyFX Speculative Sentiment Index (SSI) shows traders are net-short NZDUSD- the ratio stands at -2.73 (26.8% of traders are long)- bullish reading
- Long positions are 13.9% lower than yesterday but 21.5% higher from last week
- Short positions are 7.2% higher than yesterday but 4.6% lower from last week
- While SSI continues to broadly point higher, it’s worth noting that the recent pullback in in the ratio from has largely been attributed to liquidation of long positions (as opposed to a build in shorts) and leaves the immediate risk for a pop higher before making a final low.
---
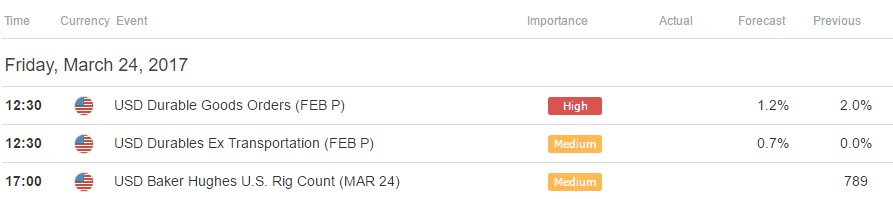
Relevant Data Releases
Other Setups in Play:
- NZDUSD Awaits RBNZ: Game Plan & Levels to Know
- AUD/USD Revisits Multi-Month Resistance
- NZD/CAD Rebound to Offer Favorable Entries- 9500 Key Resistance
- Strategy Webinar: Rate-Hike Drop Exposes U.S. Dollar Vulnerability
- Written by Michael Boutros, Currency Strategist with DailyFX
Follow Michael on Twitter @MBForex contact him at mboutros@dailyfx.com or Click Here to be added to his email distribution list.


