


GOLD PRICE OUTLOOK:
- Gold prices have risen sharply in recent weeks, but the upside momentum has faded near trendline resistance. However, a topside breakout is still possible
- The fundamental backdrop, which includes the softening U.S. dollar and falling US Treasury yields, supports precious metals
- This article looks at the key technical levels for XAU/USD to watch over the coming days
Trade Smarter - Sign up for the DailyFX Newsletter
Receive timely and compelling market commentary from the DailyFX team
Most Read: Gold Price Fails to Cash-in on US Dollar Slide Post CPI as Fed Speakers Hit the Wires
Gold prices (XAU/USD) have rebounded significantly from last month’s low set on July 21, rising nearly 7% to the edge of $1,800 per troy ounce over the course of three week, supported by a more benign environment for rate-sensitive assets. During this time, long-end U.S. Treasury yields have dropped precipitously, with the 10-year bond down about 27 basis points to 2.82%.
Falling inflation expectations, coupled with weakening U.S. economic activity, have weighed on yields, accelerating the U.S. dollar downward correction in the foreign exchange space. This combination of events has benefited precious metals, promoting their recovery in the commodities market.
Looking ahead, the macro landscape is turning increasingly bullish for XAU/USD. While cooling price pressures in the economy, as shown by the July CPI report released Wednesday morning, can sometimes be detrimental for gold, it is not necessarily the case this time because of its direct implications for the Federal Reserve’s monetary policy outlook.

The improving inflation backdrop is leading investors to reassess the central bank’s normalization cycle and to discount a less aggressive tightening path. For the September FOMC meeting, for example, expectations have downshifted over the past few days in the wake of recent data, with traders now anticipating more measured 50 bp interest rate increase rather than a supersized 75 bp adjustment. Fewer hikes on the horizon could reinforce bullion’s upside.
For now, the conversation remains focused on interest rate increases, but the narrative could pivot toward cuts later this year or in 2023 amid rapidly decelerating economic activity and fears of a hard landing. The market has been, is, and will always be forward-looking, so when Wall Street starts sniffing shifting winds, it could start to price in a looser monetary policy. Gold could thrive in this environment that now seems less distant.
| Change in | Longs | Shorts | OI |
| Daily | 1% | -3% | -1% |
| Weekly | 2% | -8% | -2% |
GOLD TECHNICAL ANALYSIS
After a powerful rally in recent weeks, gold has stalled near trendline resistance around $1,805/1,810, the line in the sand so to speak. For guidance and to better prepare for the next move, trades should keep an eye on this technical area in the coming days, but there are two possible scenarios to consider: a topside breakout and a bearish rejection.
If XAU/USD breaks out and clears the $1,805/1,810 hurdle decisively, buyers could regain control of the market, setting the stage for an advance towards $1,830, the 38.2% Fibonacci retracement of the March/July decline. On further strength, the focus shifts to the 200-day simple moving average, followed by $1,876.
On the flip side, if gold prices are rejected from current levels and begin a steep descent, the first meaningful support in play comes in at $1,755. However, if the metal breaches this floor, selling activity could accelerate, exposing the $1,725 region.
GOLD TECHNICAL CHART
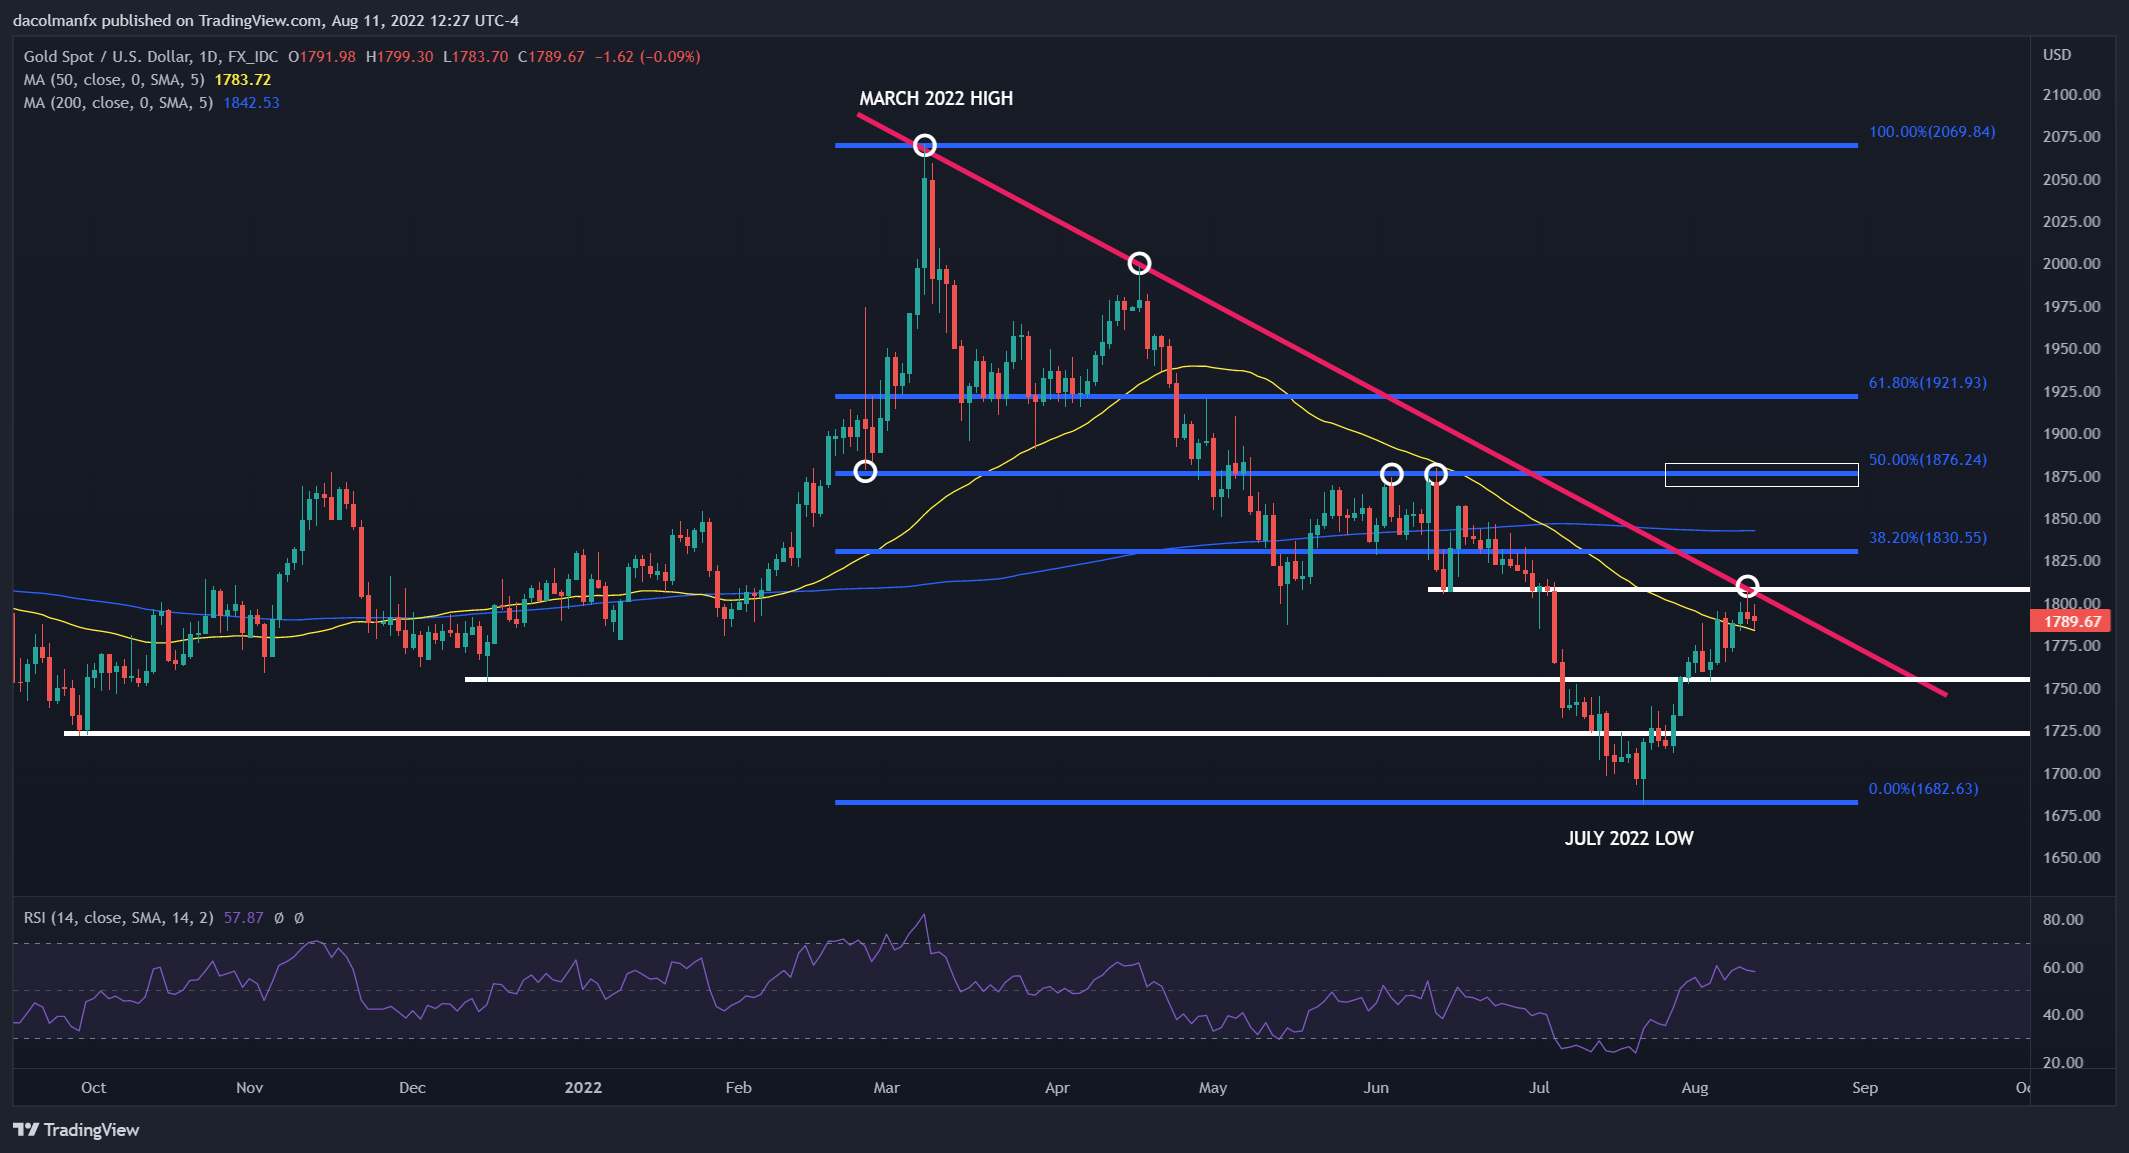
Gold Prices Chart Prepared Using TradingView
EDUCATION TOOLS FOR TRADERS
- Are you just getting started? Download the beginners’ guide for FX traders
- Would you like to know more about your trading personality? Take the DailyFX quiz and find out
- IG's client positioning data provides valuable information on market sentiment. Get your free guide on how to use this powerful trading indicator here.
---Written by Diego Colman, Market Strategist for DailyFX


