


GOLD PRICE OUTLOOK:
- Gold prices sink as hot inflation, wage growth beckon hawkish FOMC
- ISM manufacturing survey may continue to stoke ‘stagflation’ worries
- Downturn from 15-month resistance may mark key technical reversal

Gold prices swooned as expected Friday as traders put the prior day’s soft third-quarter US GDP print in the context of accelerating inflation. The Fed’s favored PCE price growth gauge showed a rise of 4.4 percent on-year in September. That’s the highest since January 1991.
More striking still, data from the Bureau of Labor Statistics (BLS) showed that the Employment Cost Index surged 1.3 percent in the third quarter, marking the biggest rise on record in at least 25 years. That portends a wage-push cost spiral whereby inflation proves to be much stickier than the Fed envisions at the moment.
The spotlight now turns to Wednesday’s FOMC policy announcement, which is broadly expectedly to bring the formal unveiling of the timeline to taper QE asset purchases through mid-2022. That would set the stage for rate hikes to follow in the second half of next year.
As it stands, the timeline implied in various comments from central officials in recent weeks suggests tapering may begin in December and see uptake reduced in increments of $20 billion per month until the program is unwound in June. The markets then price in 50bps in rate hikes before the year is out.
If the Fed appears to land on the hawkish side of those expectations when its strategy is revealed, gold is likely to face selling pressure. Alternatively, any sign of weakness in policymakers’ resolve may lift the yellow metal as investors conclude that Chair Powell and company intend to let the economy run hot.
In the interim, traders face the release of October’s ISM manufacturing survey. It is expected to show that sector output growth slowed but input prices surged to the highest in three months. That could bolster worries about ‘stagflationary’ forces that might beckon the Fed into forceful countermeasures.

GOLD TECHNICAL ANALYSIS – CANDLE PATTERN MAY MARK KEY REVERSAL
Gold prices fell as expected after prices carved out a bearish Dark Cloud Cover candlestick pattern at downtrend resistance set from August 2020. From here, a close below support anchored at 1750.78may expose 1717.89 next.The major bottom at 1676.91 is in view thereafter.
Neutralizing selling pressure appears to call for a daily close above the upper bound of the four-month range top at 1834.14, a move that would also invalidate trendline resistance. If prices attempt a push higher toward this barrier, a point of friction may emerge at 1808.16.
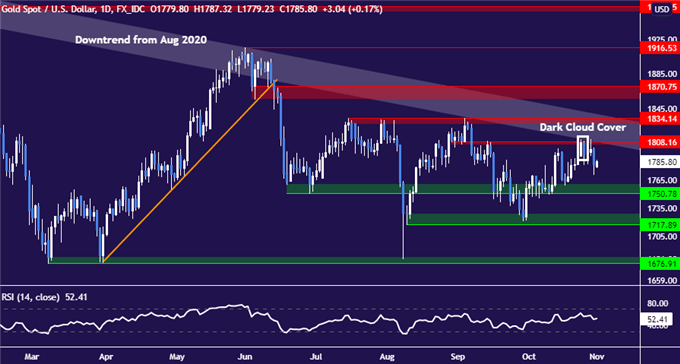
Gold price chart created using TradingView
GOLD TRADING RESOURCES
- What is your trading personality? Take our quiz to find out
- See our guide to build confidence in your trading strategy
- Join a free live webinar and have your questions answered
--- Written by Ilya Spivak, Head Strategist, APAC for DailyFX
To contact Ilya, use the comments section below or @IlyaSpivak on Twitter


