GOLD PRICE OUTLOOK:
- Gold prices idling as all eyes turn to Q3 US GDP data, slowdown expected
- ‘Stagflation’-tinged result may stoke Fed tightening speculation, hurt gold
- Technical positioning warns of on-coming downturn from trend resistance


Gold prices are idling having pulled back from a two-month high as all eyes turn to third-quarter US GDP data. The outcome will offer critical stage-setting for next week’s FOMC monetary policy announcement, which is expected to formalize plans to start tapering stimulus this year with an eye to rate hikes in 2022.
The annualized economic growth rate is expected to tick down to 2.6 percent in the in the three months to September, retreating from 6.7 percent in the prior quarter. That would put the economy essentially on pace with the trend average prevailing in the decade before the Covid-19 outbreak.
While that might sound innocuous, such a result against the backdrop of historic fiscal and monetary stimulus is a worrying sight. This seems particularly so as rising vaccination rates bring broader economic reopening. Leading PMI data chalked up weakness to capacity constraints, labor shortages and price pressures.
Keeping inflation expectations anchored against such a backdrop while supply chains mend is almost certainly on the minds of Fed officials ahead of next week’s conclave. To that end, markets may read a soft result as steeling the central bank’s resolve to trim back support, and sound convincing doing so.
Such an outcome may push the US Dollar higher alongside bond yields, weighing on non-yielding and perennially anti-fiat bullion. Follow-through may be somewhat limited however as traders seek to put the GDP reading in the context of price growth trends. This could delay the fireworks until PCE data hits the tape on Friday.


GOLD TECHNICAL ANALYSIS – XAU/USD PREPARING TO TURN LOWER?
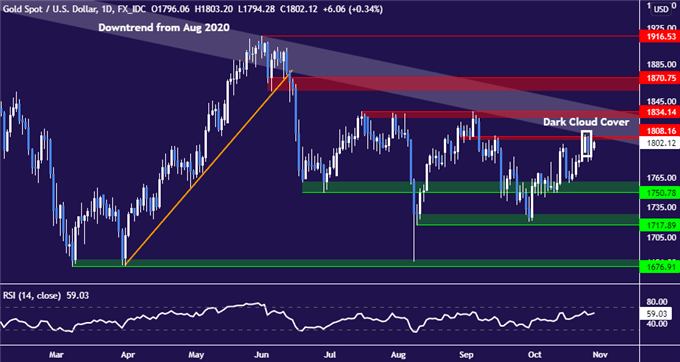
Gold prices produced a bearish Dark Cloud Cover candlestick pattern at downtrend resistance set from August 2020, hinting that a reversal may be ahead. Breaking below initial support anchored at 1750.78may set the stage for downward extension toward 1717.89.The major bottom at 1676.91 comes into play thereafter.
Neutralizing the bearish bias seems to demand a daily close above the upper bound of the four-month range top at 1834.14. If prices attempt a push higher toward this barrier, minor resistance at 1808.16 may offer some friction along the way.

Gold price chart created using TradingView
GOLD TRADING RESOURCES
- What is your trading personality? Take our quiz to find out
- See our guide to build confidence in your trading strategy
- Join a free live webinar and have your questions answered
--- Written by Ilya Spivak, Head Strategist, APAC for DailyFX
To contact Ilya, use the comments section below or @IlyaSpivak on Twitter


