


CRUDE OIL & GOLD TALKING POINTS:
- Crude oil prices betray signs of topping after 4-month surge
- API inventory data, ISM and PMI surveys now in the spotlight
- Gold prices struggling despite dramatic US Dollar selloff
Crude oil prices have largely ignored the fireworks in most other corners of the financial markets, with the WTI benchmark drifting in a narrow range. Nevertheless, August capped the largest four-month raise in over 30 years. From here, rising S&P 500 futures seem to flag a risk-on tone. That may contain selling pressure but seems unlikely to produce a lasting rally on its own.
API crude oil inventory data is on tap and will be judged against forecasts calling for a 2.2-million-barrel drawdown to be reported in official EIA statistics due to be released on the following day. Incoming ISM and PMI surveys of US manufacturing activity may also sour the mood if the pace of recovery from the Covid-19 trough appears to be slowing
GOLD STRUGGLING DESPITE SHARP US DOLLAR SELLOFF
Gold prices have been surprisingly staid since last week’s pivotal speech from Fed Chair Jerome Powell at a virtual edition of the Jackson Hole economic symposium. While the speech cemented the US central bank’s unwillingness to expand its unconventional stimulus toolkit for now, it also unveiled an ‘average inflation target’ framework that would allow tightening to be delayed for comparatively longer than before.
Looking at the US Dollar’s precipitous decline in the lead-up to Mr Powell’s speech and thereafter, one might surmise that the markets heard a decisively dovish message. That might have been expected to lift gold. And yet, the metal fell after the Fed Chair spoke (as expected) and has struggled to advance in earnest since. Buoyant risk appetite may explain why.
Non-yielding gold has seemed like an attractive store of value since mid-March as nominal interest rates cratered while the Fed’s aggressive stimulus pushed up inflation expectations, making for a negative real rate of return on cash and government bonds. A strong showing from stocks going into and after Jackson Hole suggests traders may be growing more confident in taking bets further out along the risk curve, making gold’s absence of yield unattractive in relative terms.

CRUDE OIL TECHNICAL ANALYSIS
Crude oil prices continue to idle at resistance in the 42.40-43.88 area but overall price action is taking the shape of a Rising Wedge chart formation. This may imply bearish consequences, though confirmation on a daily close below the pattern’s floor is yet to materialize. Such a move likely sees support in the 37.10-38.56 zone, and the 34.38-78 inflection region thereafter. Alternatively, a break and hold above resistance probably sets the stage for a test of the $50/bbl figure.
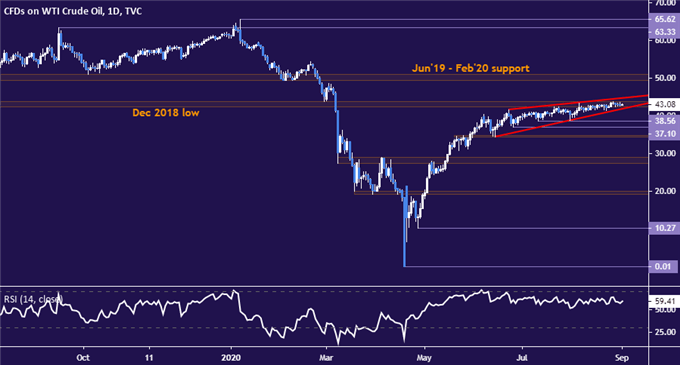
Crude oil price chart created using TradingView
GOLD TECHNICAL ANALYSIS
Gold prices are probing upward from trend line support establishing the rise from mid-March. A daily close above swing-top resistance at 2015.65 looks likely to set the stage for a test of the record high at 2076.58. Alternatively, a daily close below the $1900/oz figure would breach the near-term range floor as well as trend support, speaking to a meaningful downward reversal in the works. A decline toward the $1800/oz mark looks likely to follow in such a scenario.
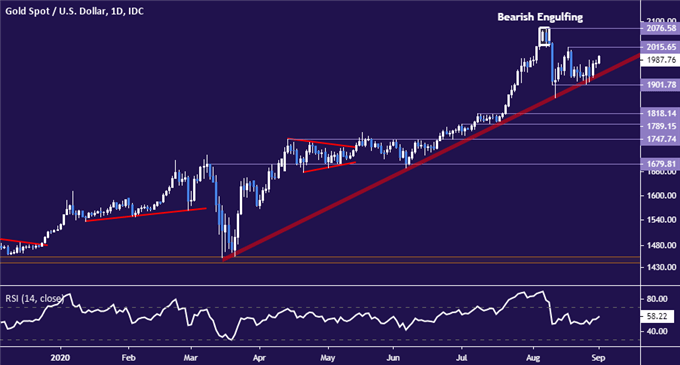
Gold price chart created using TradingView

COMMODITY TRADING RESOURCES
- See our free guide on the drivers of crude oil price trends
- What is your trading personality? Take our quiz to find out
- Join a free live webinar and have your questions answered
--- Written by Ilya Spivak, Head APAC Strategist for DailyFX
To contact Ilya, use the comments section below or @IlyaSpivak on Twitter


