


GOLD & CRUDE OIL TALKING POINTS:
- Gold prices down with stocks as US Dollar catches haven bid
- Crude oil prices manage to breach 2020 trend line resistance
- BOE guidance eyed with global recession fears at the forefront
Gold prices fell alongside the bellwether S&P 500 stock index as well as crude oil prices as financial markets’ mood darkened anew. The downbeat mood drove haven demand for the US Dollar, which undermined the appeal of anti-fiat assets epitomized by the yellow metal.
Looking ahead, downbeat guidance within a monetary policy announcement from the Bank of England may keep markets on the defensive. Stock index futures are pointing in a positive direction in late APAC trade, but – as noted yesterday before similar cues unraveled – the threat of a risk-off pivot is ever-present.
That the path of least resistance favors a defensive posture probably reflects renewed focus on the emerging global recession triggered amid the Covid-19 outbreak. Economists’ baseline forecasts see worldwide GDP shrinking 1.5 percent in 2020, marking the worst downturn since the Great Depression in the early 1930s.

GOLD TECHNICAL ANALYSIS
Gold prices are consolidating in a narrow range centered around the $1700/oz figure, with the outlines of a Symmetrical Triangle pattern starting to emerge. The setup is typically indicative of trend continuation, which carries bullish implications in this case.
A daily close above the 23.6% Fibonacci expansion at 1728.03 may act as breakout confirmation, exposing the 38.2% level at 1771.30. Alternatively, invalidation on a break below the 23.6% retracement at 1677.81 seems to target 1634.54 next.
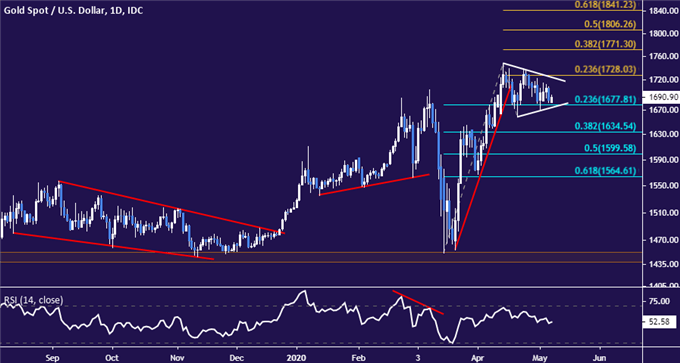
Gold price chart created using TradingView
CRUDE OIL TECHNICAL ANALYSIS
Crude oil prices broke past downward-sloping resistance leading them lower since the beginning of the year. Resistance in the 27.40-29.11 zone is now under pressure, with a break higher confirmed on a daily closing basis seeming to set the stage for a test of former support at 42.40.
Reversing below initial support in the 19.29-20.08 zone and clearing the 10.27 level seems like a prerequisite for neutralizing upside pressure. Such a move would breach the bounds of the latest upswing and appears likely to put prices on a course to challenge April’s swing bottom.
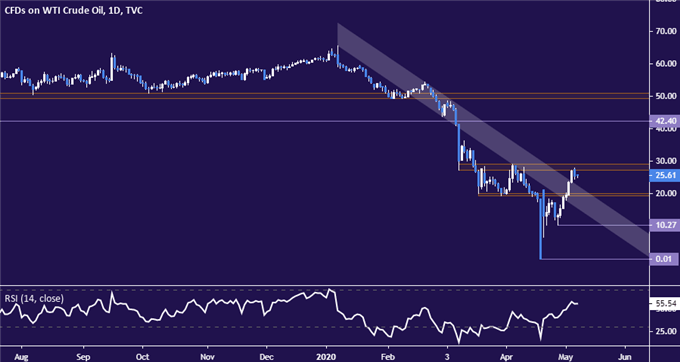
Crude oil price chart created using TradingView

COMMODITY TRADING RESOURCES
- See our guide to learn about the long-term forces driving crude oil prices
- Having trouble with your strategy? Here’s the #1 mistake that traders make
- Join a free webinar and have your commodity market questions answered
--- Written by Ilya Spivak, Currency Strategist for DailyFX.com
To contact Ilya, use the comments section below or @IlyaSpivak on Twitter


