


GOLD & CRUDE OIL TALKING POINTS:
- Crude oil prices down with stocks on US-China trade war escalation
- Gold prices probing six-year high as bond yields fall in risk-off trade
- S&P 500 futures hint risk-off push to continue, services ISM data due
Crude oil prices fell alongside stocks amid signs of deepening US-China trade war escalation in Asia Pacific trade. The WTI benchmark suffered the largest drop in 4 years last week after US President Trump announced a 10 percent tariff hike on $300 billion in Chinese imports, effective September 1.
A brief correction Friday has given way to renewed selling at the start of the new trading week after China retaliated by weakening the Yuan past the telltale 7.00 level against the US Dollar. Beijing went to say it has asked state-owned enterprises to cease importing US agricultural products.
S&P 500 futures are pointing sharply lower before Wall Street comes online, hinting that liquidation will continue. That bodes ill for the spectrum of assets anchored to the global business cycle. Energy falls squarely within this category, suggesting that oil has room to extend downward.
GOLD PRICE GAINS MAY BE LIMITED AS ISM DATA COOLS FED RATE CUT BETS
Gold prices are pushing higher as trade tensions dominate the spotlight, touching the highest level in over six years. Investors’ downbeat mood has driven bond yields lower as capital flows to the safety of government debt, boosting the relative appeal of non-interest-bearing alternatives like the yellow metal.
More of the same may be in the cards if risk-off momentum is sustained. A pickup in the pace of US service-sector activity growth expected to be reported in July’s ISM Non-manufacturing survey may be seen as limiting scope for Fed easing however, putting a floor below rates and limiting gold gains.
Get the latest crude oil and gold forecasts to see what will drive prices in the third quarter!
GOLD TECHNICAL ANALYSIS
Gold prices are probing above the July 19 high at 1452.95. An upside break confirmed on a daily closing basis exposes the 38.2% Fibonacci expansion at 1470.68 next. Immediate support is at the $1400/oz figure, followed by a dense support block running from 1375.15 down to 1346.75.

Gold chart created using TradingView
CRUDE OIL TECHNICAL ANALYSIS
Crude oil prices hit a wall after correcting higher to retest support-turned-resistance in the 54.72-56.09 area. Renewed selling from here sees initial support clustered around the $50/bbl mark. Alternatively, a daily close above 56.09 targets back-to-back trend line and inflection zone resistance capped at 60.84.
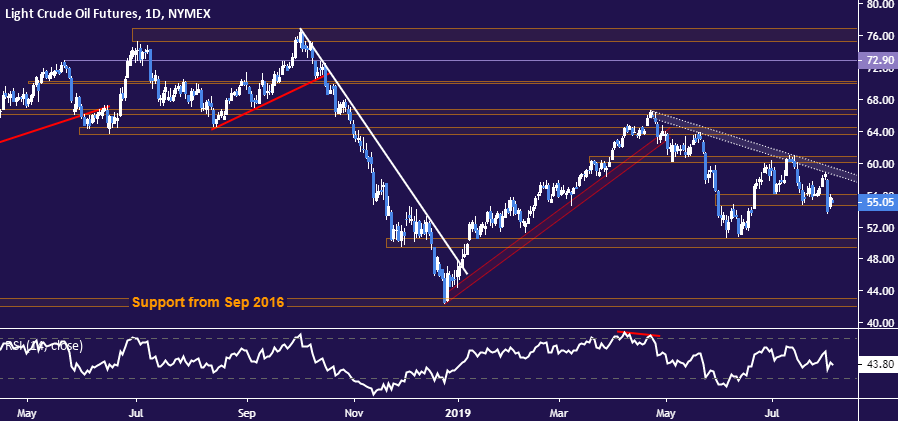
Crude oil chart created using TradingView
COMMODITY TRADING RESOURCES
- See our guide to learn about the long-term forces driving crude oil prices
- Having trouble with your strategy? Here’s the #1 mistake that traders make
- Join a free webinar and have your commodity market questions answered
--- Written by Ilya Spivak, Currency Strategist for DailyFX.com
To contact Ilya, use the comments section below or @IlyaSpivak on Twitter


