


CRUDE OIL & GOLD TALKING POINTS:
- Crude oil prices may get a lift from renewed US-China trade talks
- Gold prices at risk if PCE inflation uptick cools Fed rate cut bets
- Commodities may wait for FOMC before committing to direction
Marquee commodity prices did not stray far from familiar narrow ranges at the start of the trading week, as expected. Crude oil and gold prices meandered higher in what looked like retracements of losses registered late last week but true trend development was conspicuously absent as traders withhold conviction ahead of heavy-duty event risk due ahead.
The spotlight initially turns US-China trade negotiations. A delegation led by USTR Robert Lighthizer is in Shanghai today for the first round of face-to-face talks with their local counterparts since dialogue broke down in May. Hopeful soundbites from both sides praising re-engagement may mostly lift risk appetite, lifting crude oil. API inventory data might muddy the waters however. A 2.4-million-barrel outflow is expected.
Meanwhile, gold prices may backtrack a bit after the Fed’sfavored PCE inflation gauge crosses the wires. It is projected to show that the core price growth rate hit a four-month high at 1.7 percent in June. That might cast a bit of doubt on scope for aggressive easing, but traders will probably wait for the FOMC rate decision to truly commit one way or another.
Get the latest crude oil and gold forecasts to see what will drive prices in the third quarter!
GOLD TECHNICAL ANALYSIS
Gold prices are idling even as a Bearish Engulfing candlestick pattern and negative RSI divergence warn of topping. A daily close below rising trend sets the stage to probe the July 1 low at 1381.91. Alternatively, a push beyond the 38.2% Fibonacci expansion at 1447.90 eyes the 50% level at 1468.29 next.
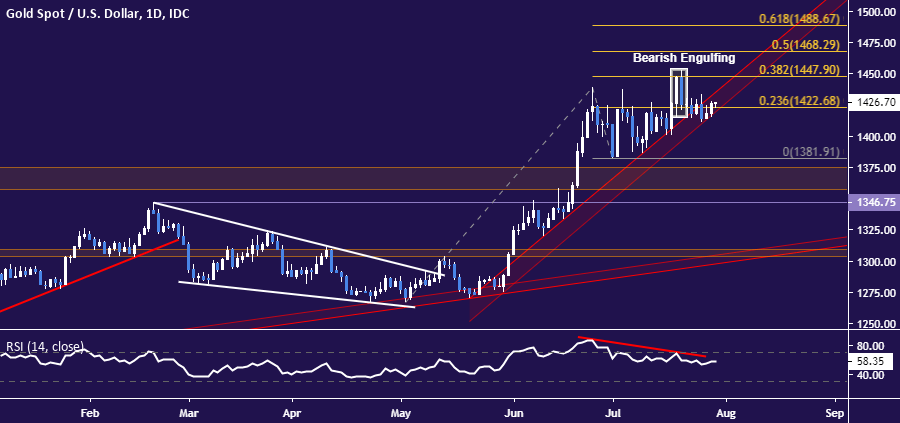
Gold chart created using TradingView
CRUDE OIL TECHNICAL ANALYSIS
Crude oil prices continue to mark time in a narrow band between support at 54.84 and resistance at 58.19. A break higher confirmed on a daily closing basis initially targets the 60.04-84 area. Alternatively, a push through the range floor opens the door to challenge the 49.41-50.60 zone.
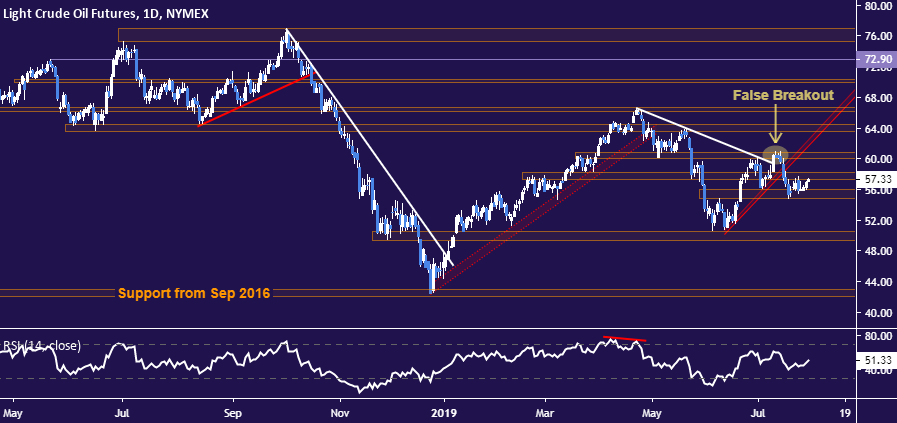
Crude oil chart created using TradingView
COMMODITY TRADING RESOURCES
- See our guide to learn about the long-term forces driving crude oil prices
- Having trouble with your strategy? Here’s the #1 mistake that traders make
- Join a free webinar and have your commodity market questions answered
--- Written by Ilya Spivak, Currency Strategist for DailyFX.com
To contact Ilya, use the comments section below or @IlyaSpivak on Twitter


