


CRUDE OIL & GOLD TALKING POINTS:
- Crude oil prices lower on IMF outlook downgrade, Italy recession woes
- Gold price rise stalls as risk aversion revives haven US Dollardemand
- ECB policy call, FOMC minutes may keep markets in a defensive mood
Crude oil prices fell alongside stocks yesterday amid a broad-based deterioration in risk appetite. The bulk of the move played out after the IMF unveiled a grim global economic outlook update (as expected). Earlier worries EU-US trade war risk and a downgrade of Italy’s growth outlook – along with its implications for renewed budgetary tensions between Rome and EU authorities – added to the downbeat mood.
Gold prices managed early gains as the US Dollar built on prior losses, but the move stalled as sentiment unraveled. The risk-off move revived haven demand for the benchmark currency, sapping the appeal of anti-fiat assets and capping gold’s advance. A parallel drop in benchmark bond yields seemed to offer enough support to head off an outright selloff however.
CRUDE OIL MAY FALL ON DOWNBEAT ECB, FOMC MINUTES
Looking ahead, the ECB monetary policy announcement as well as the release of minutes last month’s FOMC meeting are in focus. Grim rhetoric speaking to policymakers’ deepening concerns about a downshift in the global business cycle may keep markets in a defensive stance. That seems to bode ill for oil. As before, the impact on gold will depend on the relative magnitude of divergent moves in bond rates and USD.
Elsewhere, industrial production figures from Italy, France and the UK as well as the monthly UK GDP report may inform global growth bets. US CPI is also on tap. A tendency to disappoint on recent macro news-flow warns of soft results that might pressure sentiment further. Finally, EIA inventory data is seen showing stockpiles added 2.5 million barrels last week. API flagged a larger 4.09-million-barrel rise yesterday.
See the latest gold and crude oil forecasts to learn what will drive prices in the second quarter!
GOLD TECHNICAL ANALYSIS
Broadly speaking, gold price positioning still suggests a bearish Head and Shoulders topping pattern is taking shape. Confirmation of the setup is still pending and would require a break below the pattern’s neckline (now at 1283.53). A daily close above resistance in the 1303.70-09.12 area and the subsequent falling trend line set from the February 20 high – now at 1312.41 – is needed to invalidate near-term bearish cues.

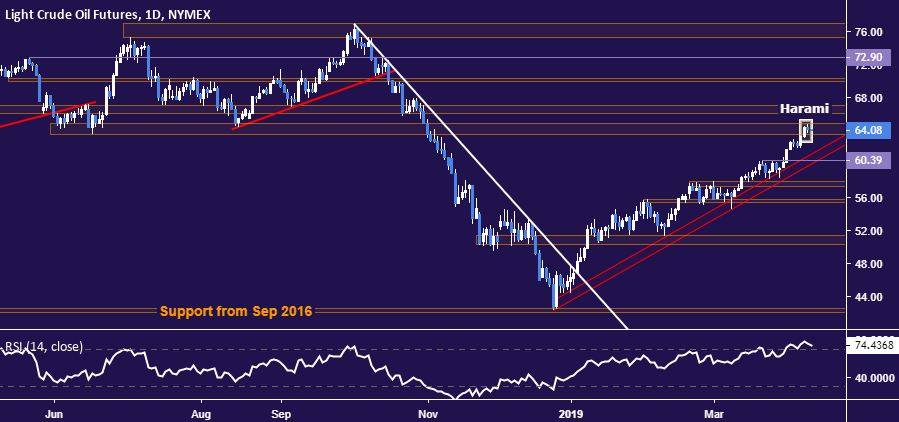
CRUDE OIL TECHNICAL ANALYSIS
Crude oil prices put in a Harami candlestick pattern below support-turned-resistance in the 63.59-64.88 area. This is a sign of indecision that may precede a downturn. A daily close below the $60/bbl figure would break the uptrend from late December and expose 57.24-88 zone. Alternatively, a push above 64.88 is followed almost immediately by another layer of resistance in the 66.09-67.03infection zone.
COMMODITY TRADING RESOURCES
- Learn what other traders’ gold buy/sell decisions say about the price trend
- Having trouble with your strategy? Here’s the #1 mistake that traders make
- Join a Trading Q&A webinar to answer your commodity market questions
--- Written by Ilya Spivak, Currency Strategist for DailyFX.com
To contact Ilya, use the comments section below or @IlyaSpivak on Twitter


