


CRUDE OIL & GOLD TALKING POINTS:
- Crude oil prices make good on bearish chart setup, hit 3-week low
- Gold prices rise as global slowdown worries weigh on bond yields
- Risk appetite may suffer further if 4Q UK GDP figures disappoint
Crude oil prices paused to digest losses Friday following a brisk, sentiment-driven drop. Gold prices rose as yields continued to drift lower amid lingering global slowdown fears. The rate on the benchmark 10-year US Treasury bond hit a weekly low, boosting the relative appeal of non-interest-bearing assets.
UK GDP DATA MAY SOUR SENTIMENT, WEIGHING ON CRUDE OIL
Fourth-quarter UK GDP data is in the spotlight from here, with forecasts pointing to a slowdown. Output is expected to have added 0.3 percent in the final three months of 2018, down from 0.6 percent in the three months to September. The on-year trend growth rate is projected to tick down to 1.4 percent.
UK economic news-flow has notably deteriorated relative to analysts’ baseline projections recently, opening the door for a disappointing outcome. That might compound concerns about a downturn in the global business cycle, sending crude oil lower alongside other risky assets.
The implications of such an outcome for gold are bit more convoluted. Support from a further drop in bond yields may be countervailed if haven-seeking capital flows buoy the US Dollar, undermining the appeal of anti-fiat alternatives epitomized by the yellow metal.
See our guide to learn about the long-term forces driving crude oil prices !
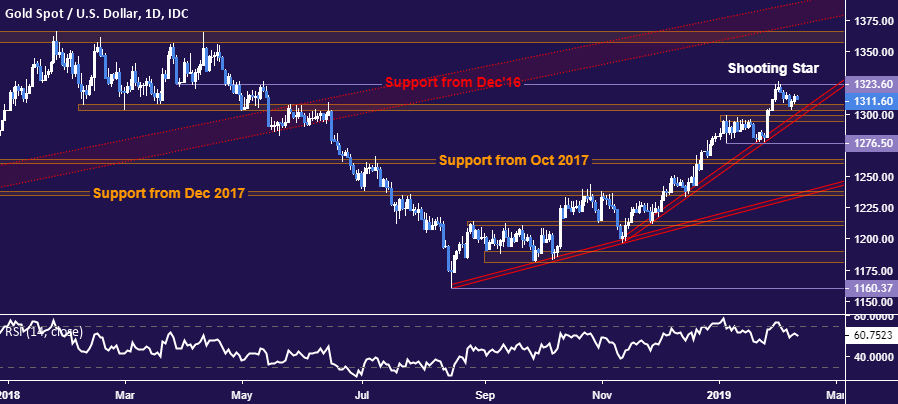
GOLD TECHNICAL ANALYSIS
Gold prices continue to stall above a dense layer of support underpinned by a rising trend line set from mid-November. A break through this barrier – confirmed on a daily close below 1294.10 – would expose the support shelf at 1276.50 next. Alternatively, a push above chart inflection point resistance at 1323.60 sets the stage for a challenge of the pivotal 1357.50-66.06 region.
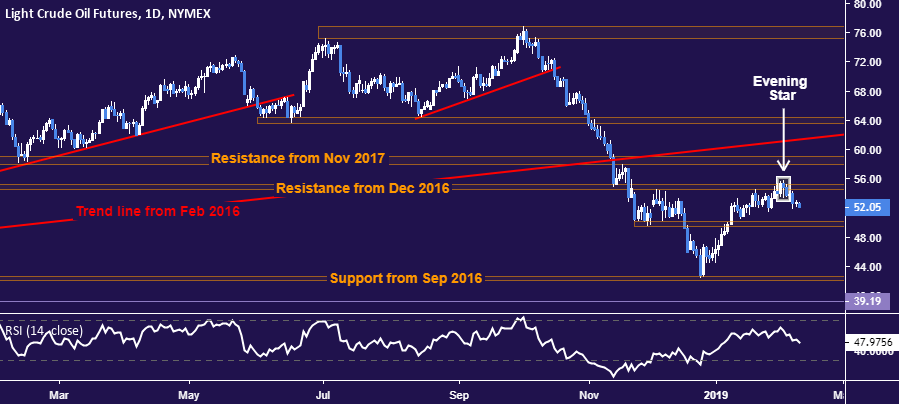
CRUDE OIL TECHNICAL ANALYSIS
Crude oil prices are edging lower after producing a bearish Evening Star candlestick pattern as expected, hitting a three-week low. From here, a daily close below support in the 49.41-50.15 area opens the door for a decline toward the 42.05-55 zone. Alternatively, a reversal back above the February 4 high at 55.75 sees the next layer of resistance in the 57.96-59.05 region.
COMMODITY TRADING RESOURCES
- Learn what other traders’ gold buy/sell decisions say about the price trend
- Having trouble with your strategy? Here’s the #1 mistake that traders make
- Join a Trading Q&A webinar to answer your commodity market questions
--- Written by Ilya Spivak, Currency Strategist for DailyFX.com
To contact Ilya, use the comments section below or @IlyaSpivak on Twitter


