GOLD & CRUDE OIL TALKING POINTS:
- Gold prices rise as bond yields drop in risk-off trade
- Sentiment-linked crude oil prices follow stocks lower
- Data from Italy, France may keep markets defensive
Gold prices rose as risk appetite fizzled amid growing concerns about slowing global growth across financial markets (as expected). That fueled haven demand for Treasury bonds and weighed on yields, bolstering the relative appeal of non-interest-bearing assets. Crude oil prices slid alongside stocks.
DATA FROM ITALY, FRANCE MAY SOUR MARKET MOOD
Looking ahead, industrial production data from Italy and France may enjoy a rare moment in the spotlight. Soft outcome echoing recent underperformance in regional news-flow may stoke fears about the countries’ inability to meet EU budget targets as economic growth cools.
Brussels took a hard line with the anti-establishment coalition government in Rome last year, pushing it to curb its appetite for expansionary fiscal policy. Another dust-up – especially one that pulls Paris into the fray – may revive regional instability worries and sour the broader markets’ mood.
That sets the stage for yesterday’s trade patterns to be repeated, with gold edging higher as yields decline and oil following shares downward. Indeed, futures tracking the bellwether S&P 500 stock index are pointing convincingly lower in APAC trade, pointing to a risk-off bias ahead.
Learn what other traders’ gold buy/sell decisions say about the price trend!
GOLD TECHNICAL ANALYSIS
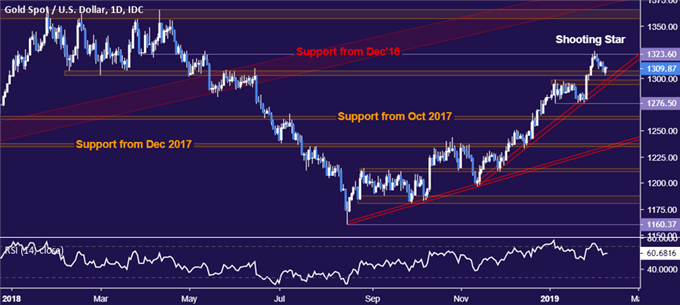
A downswing in gold prices stalled as sellers began to test a dense support area underpinned by a rising trend line set from mid-November (now at 1293.89). A daily close below initially exposes 1276.50. Alternatively, a bounce above chart inflection point resistance at 1323.60 aims for the 1357.50-66.06 region next.

CRUDE OIL TECHNICAL ANALYSIS
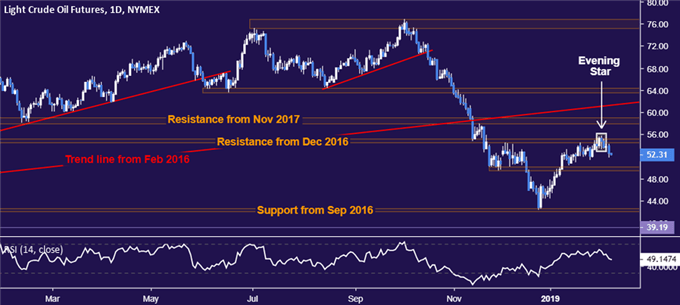
Crude oil prices turned lower after putting in a bearish Evening Star candlestick pattern, as expected. A break below support in the 49.41-50.15 area sets the stage for a test of the 42.05-55 zone. Alternatively, a turn back above the February 4 high at 55.75 sees the next upside hurdle in the 57.96-59.05 region.

COMMODITY TRADING RESOURCES
- See our guide to learn about the long-term forces driving crude oil prices
- Having trouble with your strategy? Here’s the #1 mistake that traders make
- Join a Trading Q&A webinar to answer your commodity market questions
--- Written by Ilya Spivak, Currency Strategist for DailyFX.com
To contact Ilya, use the comments section below or @IlyaSpivak on Twitter


