


GOLD & CRUDE OIL TALKING POINTS:
- Gold prices stall as prices begin to test near-term trend support
- Crude oil prices drop, producing a bearish technical formation
- EIA inventory flow data headlines otherwise lackluster calendar
Gold prices managed a modest upswing yesterday. The benchmark for non-interest-bearing assets pulled up as bond yields corrected lower after two days of gains scored in the wake of Friday’s upbeat US jobs report. A rising US Dollar undercut anti-fiat demand however, capping gold’s upside potential.
Crude oil prices fell but the driver of the drop was not clear. The newswires cited soft US ISM data, but the drop started close to 4 hours before its release. A raft of recognitions of Juan Guaido as Venezuela’s President from European capitals may have helped. with hopes that international pressure will shorten the political crisis there chipping away at worries about a prolonged supply disruption.
EIA INVENTORY DATA HEADLINES QUIET ECONOMIC CALENDAR
Looking ahead, a lull in big-splash scheduled event risk might leave commodity markets somewhat rudderless. A strong lead from sentiment trends seems to be absent too, with bellwether S&P 500 futures trading conspicuously flat in Asia Pacific hours. That may translate into a consolidative session.
EIA inventory flow data is expected to show stockpiles added 1.42 million barrels last week. An estimate from API published yesterday envisioned a larger 2.51-million-barrel build. If the official release hews closer to that reading, the pullback in crude oil prices may continue.
Learn what other traders’ gold buy/sell decisions say about the price trend!
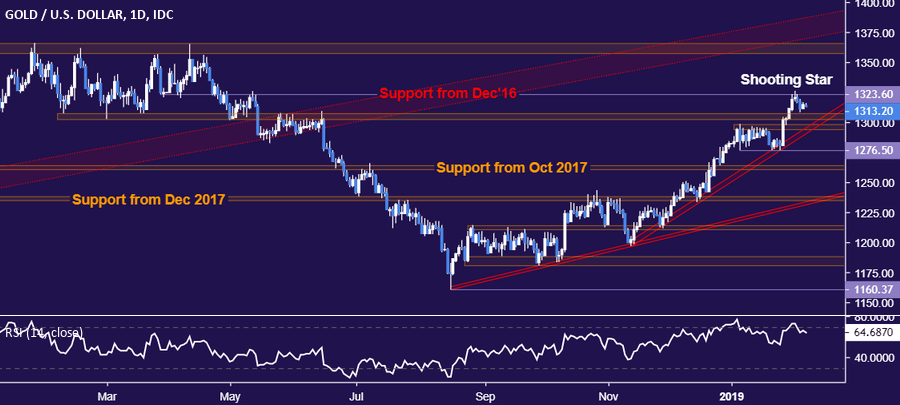
GOLD TECHNICAL ANALYSIS
A pullback in gold prices stalled ahead of a dense layer of support underpinned by a rising trend line set from mid-November, now at 1291.80. A daily close below that exposes the range bottom at 1276.50. Alternatively, a breach above chart inflection point resistance at 1323.60 sets the stage for a test of pivotal resistance in the 1357.50-66.06 region.
CRUDE OIL TECHNICAL ANALYSIS
Crude oil prices put in a bearish Evening Star candlestick pattern, hinting the upswing from late-December lows may be ending. Initial support is in the 49.41-50.15 area, with a break below that setting the stage for a retest of the 42.05-55 zone. Alternatively, a push above the February 4 high at 55.75 targets the 57.96-59.05 region next.

COMMODITY TRADING RESOURCES
- See our guide to learn about the long-term forces driving crude oil prices
- Having trouble with your strategy? Here’s the #1 mistake that traders make
- Join a Trading Q&A webinar to answer your commodity market questions
--- Written by Ilya Spivak, Currency Strategist for DailyFX.com
To contact Ilya, use the comments section below or @IlyaSpivak on Twitter


