


GOLD & CRUDE OIL TALKING POINTS:
- Gold prices struggle as yields, US Dollar diverge amid sentiment swings
- Crude oil prices tracking stock markets’ response to fizzling risk appetite
- Third-quarter US GDP data may serve to amplify risk-off trade dynamics
Gold prices tiptoed lower while crude oil prices rose tepidly with stocks amid a brief interlude in the broad-based risk appetite collapse defining financial markets this week (as expected). These moves’ corrective character was made plain soon enough however as sentiment soured anew in Asia Pacific trade.
Regional shares plunged and the WTI benchmark followed. Gold probed higher as yields fell but haven-seeking demand for the US Dollar made for paltry progress. S&P 500 futures are pointing sharply lower, hinting at more of the same on tap in hours ahead.
Third-quarter US GDP data may amplify the risk-off push. Growth is seen slowing to an annualized rate of 3.3 percent, down from the four-year high of 4.2 percent previously. That is both a large-enough comedown to rattle already jittery investors and a strong-enough print to keep Fed rate hikes on track.
See our gold forecast to learn what is likely to drive price action through year-end!
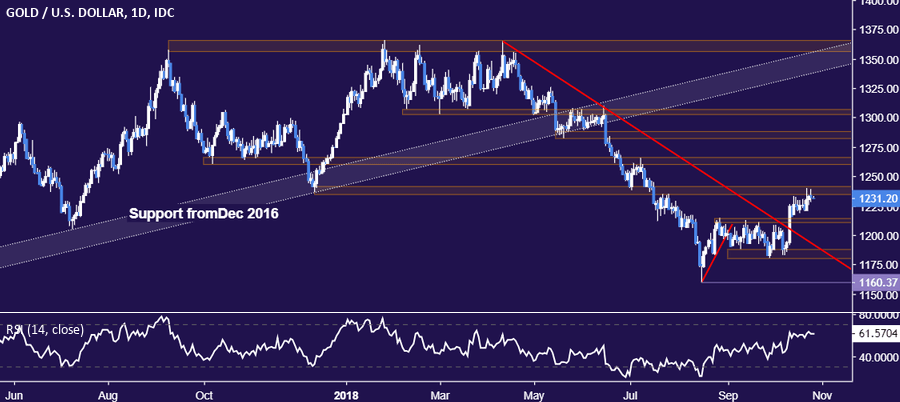
GOLD TECHNICAL ANALYSIS
Gold prices failed to make good on yet another attempt to breach resistance in the 1235.24-41.64 area. Reversing lower from here sees support in the 1211.05-14.30 zone, with a break below that targeting the September 28 low at 1180.86. Alternatively, a rally beyond resistance exposes the 1260.80-66.44 region.
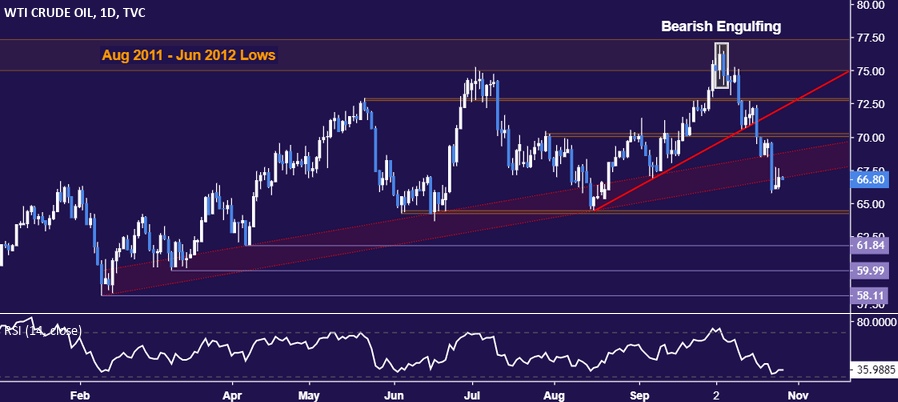
CRUDE OIL TECHNICAL ANALYSIS
Crude oil prices edged meekly higher but the recovery was ably capped by support-turned-resistance set from early February, now in the 66.87-68.74 area. Renewed selling sees initially targets the 64.26-45 area, with a daily close below that exposing April’s swing low at 61.84. Alternatively, a move back above 68.74 paves the way for a retest of the 70.05-26 region. Longer-term technical positioning hints a major top is in the works.
COMMODITY TRADING RESOURCES
- See our guide to learn about the long-term forces driving crude oil prices
- Having trouble with your strategy? Here’s the #1 mistake that traders make
- Join a Trading Q&A webinar to answer your commodity market questions
--- Written by Ilya Spivak, Currency Strategist for DailyFX.com
To contact Ilya, use the comments section below or @IlyaSpivak on Twitter


