


CRUDE OIL & GOLD TALKING POINTS:
- Crude oil and gold prices drop as Sino-US trade war fears sour sentiment
- OPEC seminar may be preview of Vienna strategy session on output curbs
- ECB Forum may offer crucial glimpse of global trends in monetary policy
Crude oil prices turned lower as risk appetite soured across financial markets amid signs of escalation in the Sino-US trade war, weighing on the spectrum of sentiment-linked assets to varying degrees. Gold pricesfell as haven demand sent the US Dollar higher, sapping the appeal of anti-fiat alternatives and overwhelming the supportive influence of falling bond yields.
OPEC SEMINAR, ECB FORUM IN THE SPOTLIGHT
From here, official EIA inventory data is expected to show US crude stockpiles shed 2.43 million barrels last week. API numbers published yesterday pointed to a nominally larger 3.02 million barrel outflow, which may foreshadow a narrow upside surprise. That seems unlikely to have a lasting impact on price action however as all eyes remain on the upcoming OPEC+ meeting.
With that in mind, soundbites from the OPEC International Seminar might prove most market-moving. Ministers from all of the cartel’s member states are due to attend and their interaction each other as well as the media might offer a glimpse of what to expect when they are joined by representatives of other to producers in Vienna Friday to discuss the fate of coordinated output curbs.
Meanwhile, comments from the ECB Forum in Sintra, Portugal might emerge as the catalyst for gold prices. The gathering of leading economists and central bank officials is has taken up the key policy issue of the past decade: growth and labor markets have recovered smartly from the Great Recession but inflation remains stubbornly low, making ultra-loose monetary settings the norm.
The yellow metal most frequently trades as natural foil to paper currencies, so keeping global rates low for an extended period is necessarily supportive. On the other hand, the upward pressure exerted on worldwide borrowing costs by Fed tightening is a natural headwind. Commentary suggesting how this narrative might evolve from the very people that are steering policy might thus translate into volatility.
See our guide to learn about the long-term forces driving crude oil prices !
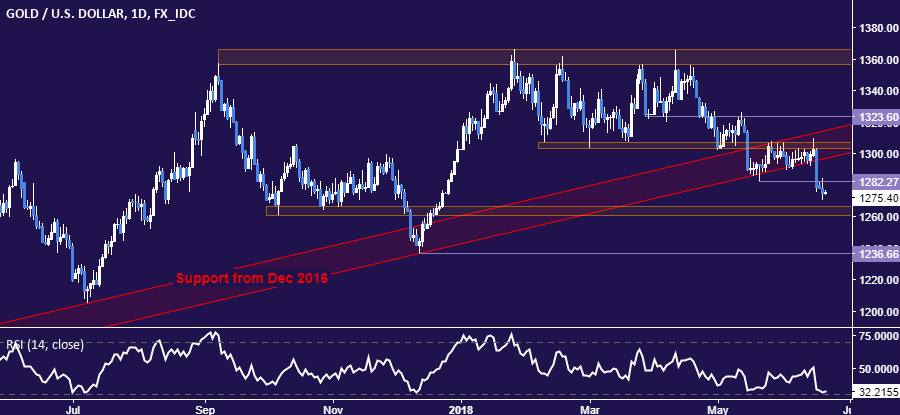
GOLD TECHNICAL ANALYSIS
Gold prices continue to edge lower after breaking the uptrend set from December 2016. Near-term support is in the 1260.80-66.44 area, with a daily close below that exposing the December 2017 low at 1236.66. Alternatively, a reversal above support-turned-resistance marked by the May 21 low at 1282.27 opens the door for a retest of the $1300/oz figure.
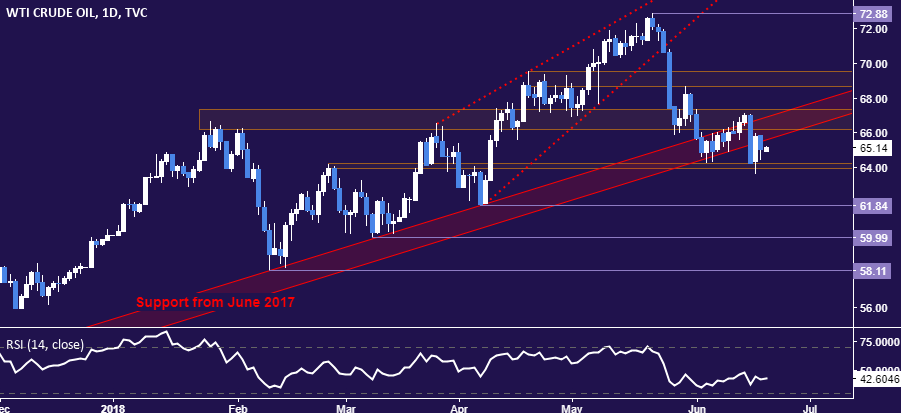
CRUDE OIL TECHNICAL ANALYSIS
Crude oil prices are digesting above support in the 63.96-64.26 area after breaking the bounds of the rising trend set from June 2017. A break lower confirmed on a daily closing basis initially exposes the April 6 low at 61.84. Critical resistance remains in the 66.22-67.36 zone, with a break above that needed to neutralize the near-term bearish bias.
COMMODITY TRADING RESOURCES
- Learn what other traders’ gold buy/sell decisions say about the price trend
- Having trouble with your strategy? Here’s the #1 mistake that traders make
- Join a Trading Q&A webinar to answer your commodity market questions
--- Written by Ilya Spivak, Currency Strategist for DailyFX.com
To contact Ilya, use the comments section below or @IlyaSpivak on Twitter


