


Talking Points:
- Gold prices eye Fed-speak as possible breakout trigger from Triangle pattern
- Crude oil prices may stage recovery as risk appetite brightens across markets
- What do retail traders’ bets say about on-coming gold moves? Find out here
Gold prices retreated from intraday highs after upbeat US CPI and retail sales data crossed the wires. The core year-on-year inflation rate unexpectedly rose to 1.8 percent – the highest in six months – while receipts added 0.2 percent to top forecasts calling for a flat result.
The US Dollar rose alongside front-end Treasury bond yields while the priced-in 2018 rate hike path implied in Fed Funds futures steepened after the data printed, undermining support for anti-fiat and non-interest-bearing assets. A series of speeches from FOMC officials are now in focus.
Crude oil prices digested losses after yesterday’s sharp selloff. EIA data showing an unexpected inventory increase failed to impress having been foreshadowed by API figures released on the prior day. Risk trends might take the reins from here, with an upbeat lead from S&P 500 futures hinting at a possible bounce.
What are the forces driving long-term crude oil price trends? See our free guide to find out!
GOLD TECHNICAL ANALYSIS – Gold prices continue to hover above support at the lower bound of a would-be bearish Triangle chart pattern, a barrier reinforced by the 38.2% Fibonacci expansion at 1272.01. Breaching that on a daily closing basis exposes the 1260.80-61.50 area (October 6 low, 50% level). Alternatively, a push above Triangle resistance at 1293.40 targets 1306.04, the October 16 high.
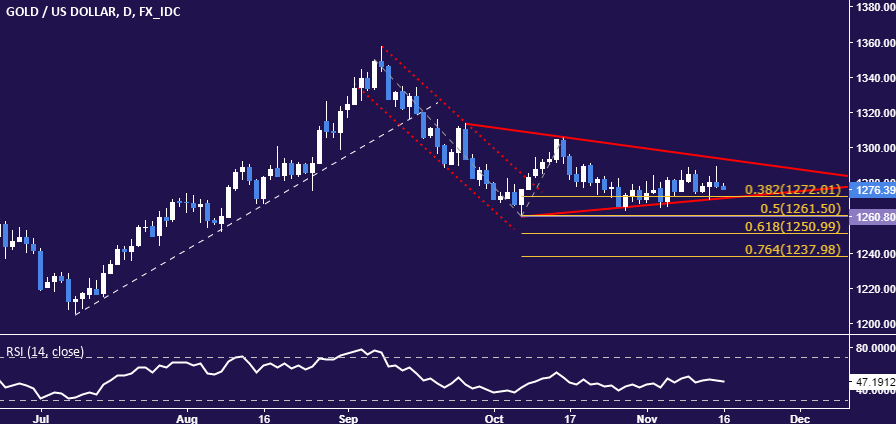
Chart created using TradingView
CRUDE OIL TECHNICAL ANALYSIS – Crude oil prices paused to consolidate losses above the 23.6% Fibonacci retracement at 55.01. A break of this barrier confirmed on a daily closing basis sees the next downside threshold at 53.21, the 38.2% level. Alternatively, a turn back above the 14.6% Fib at 56.12 exposes the November 8 high at 57.92 anew.
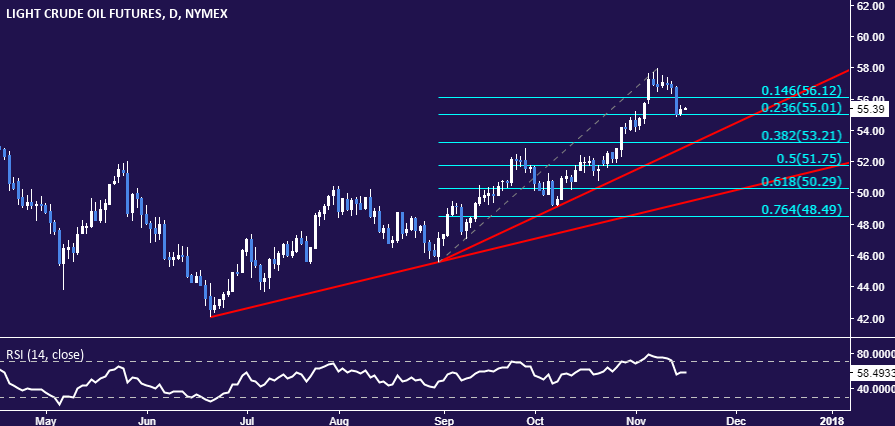
Chart created using TradingView
--- Written by Ilya Spivak, Currency Strategist for DailyFX.com
To receive Ilya's analysis directly via email, please SIGN UP HERE
Contact and follow Ilya on Twitter: @IlyaSpivak


