


Talking Points:
- Crude oil prices sink as EIA inventory data points to weak demand
- Gold prices suffer sharp reversal on hawkish FOMC rate decision
- US political jitters sour market mood anew, may offer gold a lifeline
Crude oil prices swooned as EIA inventory data stoked oversupply fears. Raw material stockpiles shed 1.66 million barrels, a smaller draw than the 2.3 million expected, while gasoline stores unexpectedly added 2.1 million barrels. That marks the second consecutive weekly gain and hints at weak demand even against the backdrop of the summer US “driving season”.
Gold prices swung from gains to losses yesterday. Soft US CPI and retail sales figures sent the yellow metal sharply higher toward what would could have been the biggest daily increase in a month. A hawkish FOMC policy announcement changed all that however, sending it sharply lower as the US Dollar and Treasury bond yields soared in tandem and sapped support for anti-fiat and non-interest-bearing assets.
Looking ahead, a lull in top-tier event risk may put sentiment trends at the forefront. The markets’ mood began to sour in overnight trade following reports that US President Trump is being personally targeted in obstruction of justice investigation. European shares are following their Asian counterparts lower and S&P 500 futures are taking heavy losses, pointing to more of the same when Wall Street comes online.
Risk-off dynamics may offer gold a lifeline as haven-seeking capital pours into government bonds, pressuring yields downward and thereby boosting the metal’s relative appeal. As for crude oil, prices are in digestion mode for now and may end up treading water absent specific catalysts. A severe-enough meltdown in risk appetite may yet echo in the cycle-sensitive commodity however.
Retail traders are betting on gold price gains. Find out here what that hints about the coming trend!
GOLD TECHNICAL ANALYSIS – Gold prices have dropped to the lowest level in three weeks. From here, a daily close below the 50% Fibonacci retracement at 1255.23 targets the 1241.20-45.59 area (chart inflection point, 61.8% level). Alternatively, a reversal back above the 38.2% Fib sees the next upside barrier at 1276.79, the 23.6% retracement.
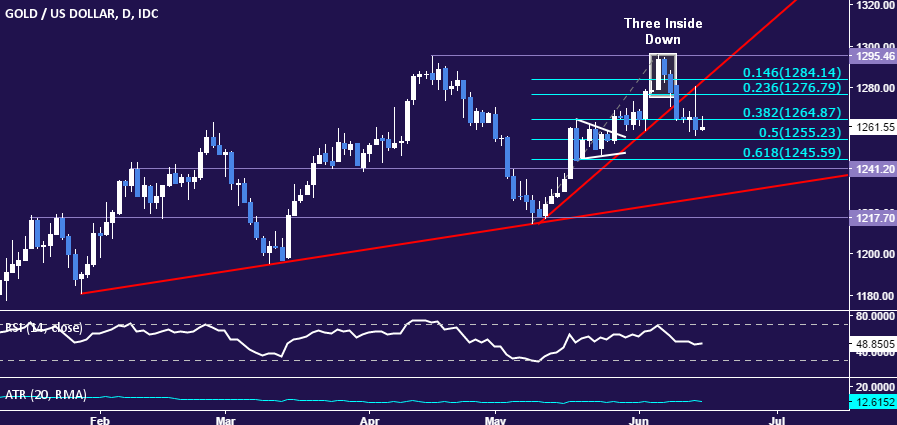
Chart created using TradingView
CRUDE OIL TECHNICAL ANALYSIS – Crude oil prices are poised to test support in the 43.79-44.10 area (channel floor, May 5 low, 38.2% Fibonacci expansion). A break below that on a daily closing basis exposes the 50% level at 43.30. Alternatively, a reversal back above the 45.09-32 zone (23.6% Fib, May 4 low) opens the door for a retest of the 46.69-47.12 region (June 12 high, chart inflection point).
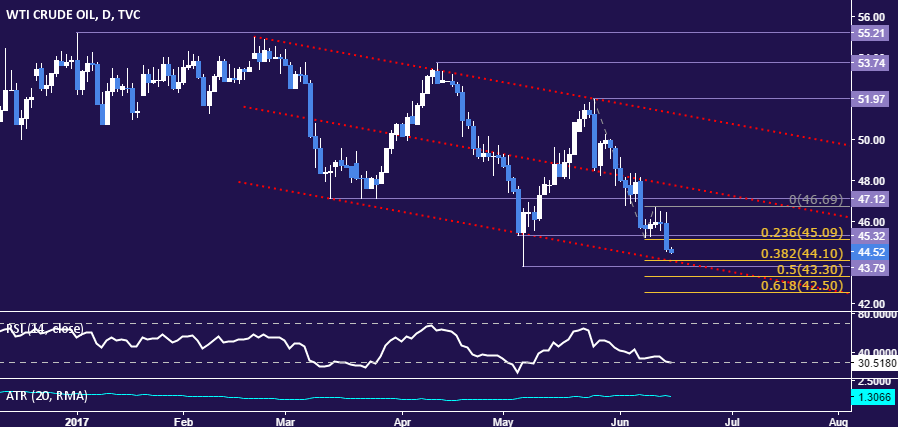
Chart created using TradingView
--- Written by Ilya Spivak, Currency Strategist for DailyFX.com
To receive Ilya's analysis directly via email, please SIGN UP HERE
Contact and follow Ilya on Twitter: @IlyaSpivak


