


Talking Points:
- Crude oil price look to EIA inventory data to extend advance
- Gold prices rise as US Dollar declines after FOMC minutes
- Hawkish Fed commentary may reboot rate hike speculation
Crude oil prices are on the upswing after API weekly inventory data showed a drawdown of 884k barrels, ending six consecutive weeks of inflows. Official EIA figures are expected to show a move in quite the opposite direction, with consensus forecasts pointing to a gain of 3.39 million barrels. A print closer to the API estimate may give prices a further lift. If a sizable build is indeed reported however, that may cap gains.
Gold prices got a boost as the US Dollar fell after yesterday’s release of minutes from February’s FOMC meeting, which traders evidently found less convincingly hawkish than they hoped. Gains may prove short-lived however if upcoming comments from Dennis Lockhart and Robert Kaplan, the Atlanta Fed President and his Dallas counterpart, echo the bolder hawkish tone of more recent rhetoric.
Are crude oil and gold prices behaving as DailyFX analysts expected so far in 2017? Find out here !
GOLD TECHNICAL ANALYSIS – A pair of bearing candlestick patterns – a Dark Cloud Cover and an Engulfing – continue to hint gold prices may be carving out a double top. Follow-through has been conspicuously absent however. From here, a daily close below the 23.6% Fibonacci retracement at 1215.75 exposes the 38.2% levelat 1197.99. Alternatively, a push above the 23.6% Fib expansion at 1245.29 targets the 38.2% level at 1263.05.
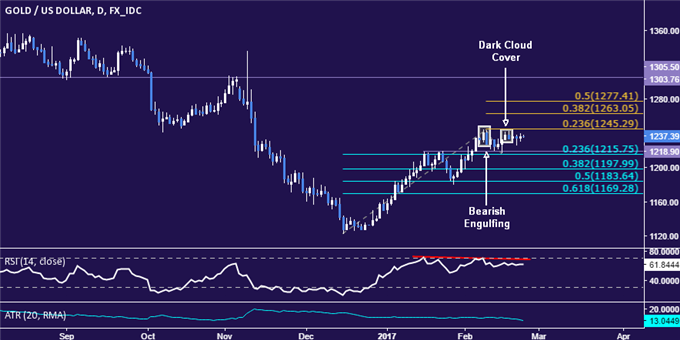
Chart created using TradingView
CRUDE OIL TECHNICAL ANALYSIS – Crude oil prices appear to have completed a Triangle chart pattern, hinting at upside continuation following a prolonged period in digestion mode. Near-term resistance is in the 55.21-65 area (January 3 high, 38.2% Fibonacci expansion), with a daily close above that targeting the 50% level at 57.18. Alternatively, a reversal below Triangle resistance-turned-support at 53.76 exposes the trend line doubling as the pattern’s floor, now at 52.09.
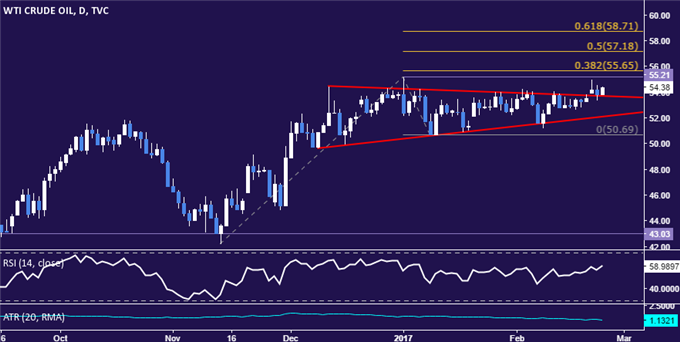
Chart created using TradingView
--- Written by Ilya Spivak, Currency Strategist for DailyFX.com
To receive Ilya's analysis directly via email, please SIGN UP HERE
Contact and follow Ilya on Twitter: @IlyaSpivak


