


Talking Points:
- Gold prices may rise after forming bullish candle pattern
- Crude oil prices retreat to familiar range support again
- UK, Eurozone PMIs to hint at post-Brexit growth trends
Commodity markets will be focused on gauging the degree of post-Brexit slowing in economic activity on both sides of the English Channel in the final hours of the trading week as July’s flash PMI surveys cross the wires. Significant slowdown is expected on both fronts.
Disappointing news-flow is likely to weigh on cycle-sensitive crude oil prices. Meanwhile, gold prices may trade higher as the onset of risk aversion boosts bonds and sends yields lower, bolstering the relative appear of non-interest-bearing assets. Upbeat figures will probably produce the opposite results.
Where are gold and crude oil prices heading in the second quarter? See our forecasts here !
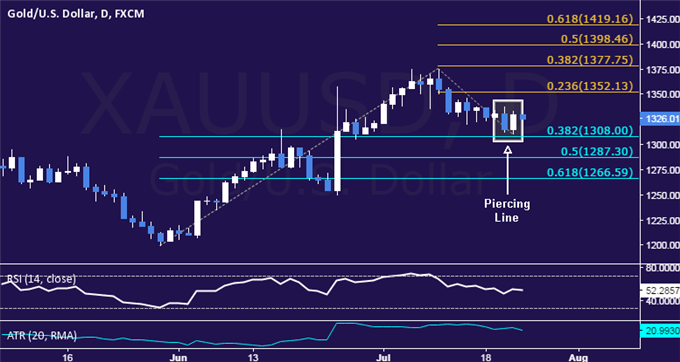
GOLD TECHNICAL ANALYSIS – Gold prices put in a bullish Piercing Line candlestick pattern, hinting a move higher may be ahead. A daily close above the 23.6% Fibonacci expansion at 1352.13 exposes the 38.2% level at 1377.75. Alternatively, a reversal below the 38.2% Fib retracement at 1308.00 targets the 50% threshold at 1287.30.
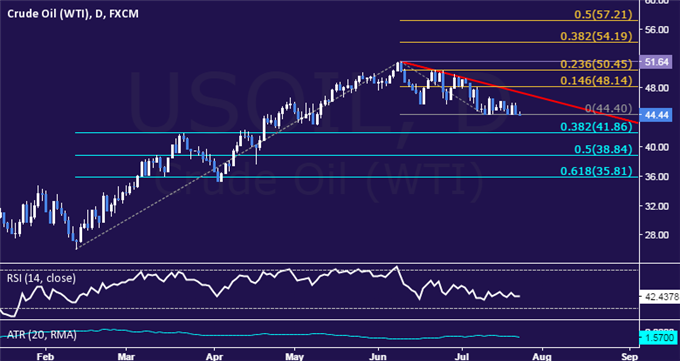
CRUDE OIL TECHNICAL ANALYSIS – Crude oil prices slumped back to familiar range support above the $44/bbl figure. A daily close below the July 11 low at 44.40 targets the 38.2% Fibonacci retracement at 41.86. Alternatively, a push above the intersection of a falling trend and the 14.6% Fib expansionat 48.14 exposes the 50.45-51.64 area (23.6% expansion, June 9 high).
--- Written by Ilya Spivak, Currency Strategist for DailyFX.com
To receive Ilya's analysis directly via email, please SIGN UP HERE
Contact and follow Ilya on Twitter: @IlyaSpivak


