


Asia Pacific Market Open – Dow Jones, US China Trade War, AUD/USD, ASX 200
- US stocks gapped higher but the revival of US China trade war fears sent the S&P 500 lower
- The US Dollar gained as a liquid safe haven while sentiment-linked crude oil prices declined
- Dow Jones fell but daily chart warns of a reversal. Asia shares may echo Wall Street losses
See our study on the history of trade wars to learn how it might influence financial markets!
US stock markets happily followed European indexes higher at open. The Dow Jones then entered consolidation mode until it not only pared gains, but then also tumbled as much as 2.6%. The revival of trade war fears seemed to be the culprit. Reports that the US was planning the next Chinese tariff wave should talks between Presidents Donald Trump and Xi Jinping fail in November aligned with the selloff.
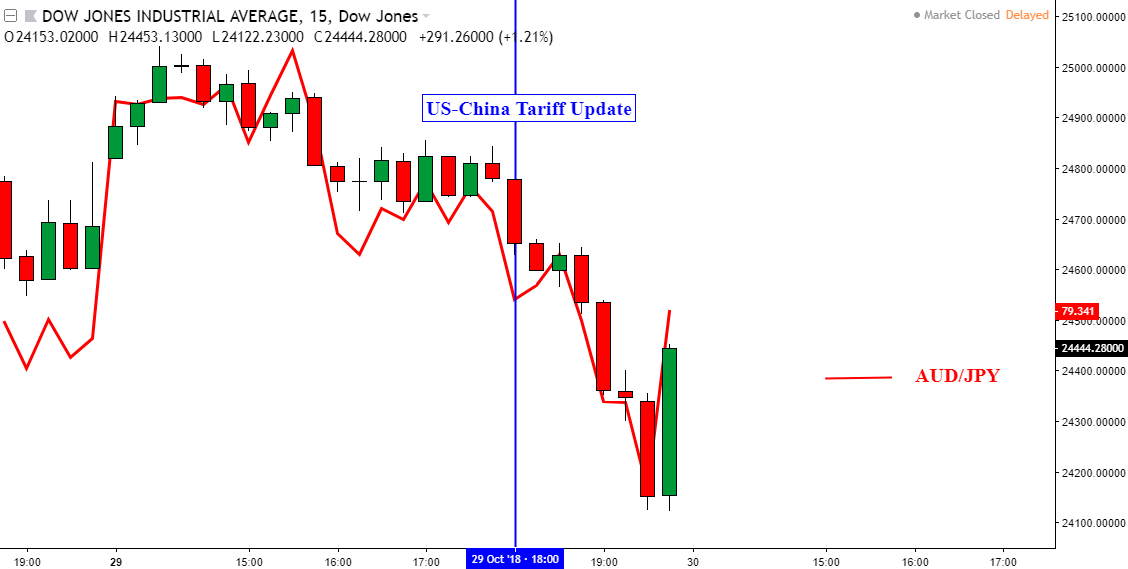
Chart created in TradingView
In general, market mood deteriorated during the latter half of the US trading session. The S&P 500 and NASDAQ Composite declined about 0.66% and 1.63% respectively. This allowed the US Dollar to benefit given its status as a highly liquid safe haven. Both the pro-risk Australian and New Zealand Dollars thus trimmed their progress made when risk appetite firmed in Asia Pacific trade.
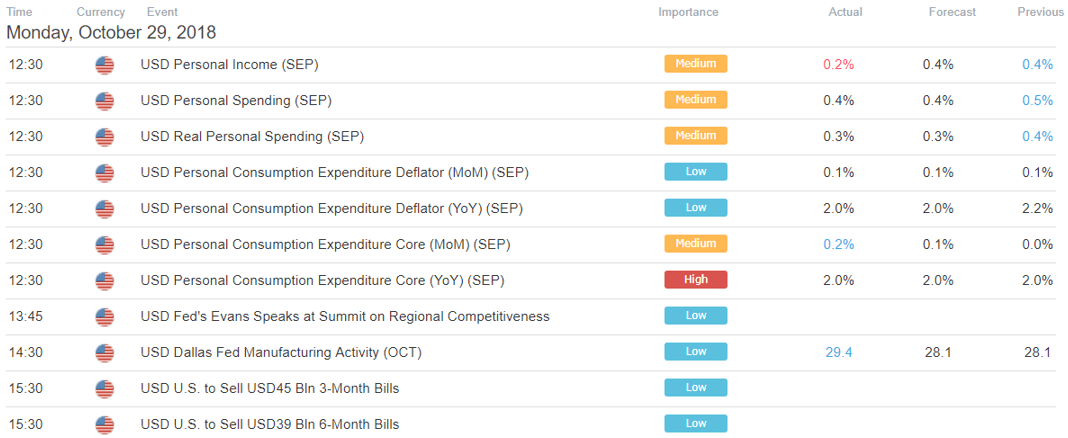
Meanwhile the anti-risk Japanese Yen held on to most of its losses and was left little changed against its major counterparts by the end of the day. The gains it saw during the second half of Monday were not as pronounced as the losses seen prior. Sentiment-linked crude oil prices also tumbled by the most in a week as expected. Largely in-line US PCE inflation data was overshadowed by more prominent market themes.
In a week that is packed with event risk, Tuesday’s APAC session is still notably lacking critical ones which places sentiment as the primary driver for markets. S&P 500 futures are pointing cautiously lower and we may see the Nikkei 225 or ASX 200 echo the lackluster performance on Wall Street. This may drive the Yen higher and my AUD/USD short remains in play ahead of tomorrow’s Australian inflation report.
I will be hosting live coverage of Australia’s third quarter CPI report, covering Aussie crosses on Wednesday the 31st beginning at 00:15 GMT
Dow Jones Industrial Technical Analysis
The Dow Jones Industrial is overshadowed by building bullish price signals that arealso seen in the S&P 500. We have a falling wedge, which is a continuation pattern, and it may precede a rise in the index that was seen from late June to early October. Simultaneously, positive RSI divergence warns that downside momentum is ebbing.
Meanwhile a rising range of support from February failed to be breached as prices rebounded back into it during the final moments of the 29th. A close above the descending resistance line in the falling wedge would still require further confirmation of a reversal. Meanwhile a close under 23,997 exposes 23,509 which were the lows achieved back in March and May.
Dow Jones Industrial Daily Chart

Forecasts:
Japanese Yen Fundamental Outlook
Australian Dollar Technical Outlook
US Trading Session
Asia Pacific Trading Session
** All times listed in GMT. See the full economic calendar here
FX Trading Resources
- Just getting started? See our beginners’ guide for FX traders
- See how equities are viewed by the trading community at the DailyFX Sentiment Page
- Join a free Q&A webinar and have your trading questions answered
- See our free guide to learn what are the long-term forces driving US Dollar prices
--- Written by Daniel Dubrovsky, Junior Currency Analyst for DailyFX.com
To contact Daniel, use the comments section below or @ddubrovskyFX on Twitter


