


CRUDE OIL & GOLD TALKING POINTS:
- Crude oil prices aim lower as chart setup hints at major top in place
- Gold prices struggle for direction, technical cues hint at downswing
- WTO to consider US vs China complaint, US PCE inflation data due
Crude oil prices recovered some lost ground as a pullback in the US Dollar offered de-facto support to assets priced in terms of the benchmark currency on global markets. Gold prices struggled to make good on the Greenback’s retracement however, retreating from intraday highs as recovering risk appetite in the last hours of the trading week buoyed Treasury bond yields alongside stocks.
Looking ahead, sentiment trends are likely to remain in focus. The WTO will consider whether to take up a US complaint against China, which it says has violated the international body’s intellectual property rules. If an investigation follows, that may be seen as aggravating the on-going trade war, souring risk appetite and pressuring on oil prices.
An upside surprise on the Fed’s favored US PCE inflation gauge may compound risk-off dynamics and punish gold amid worries about accelerated tightening. Core price growth is expected to print at 2 percent on-year in September, unchanged from the prior month. PMI survey data suggests a dramatic pickup in cost burdens linked to tariff hikes and higher borrowing costs however.
See our crude oil forecast to learn what is likely to drive price action through year-end!
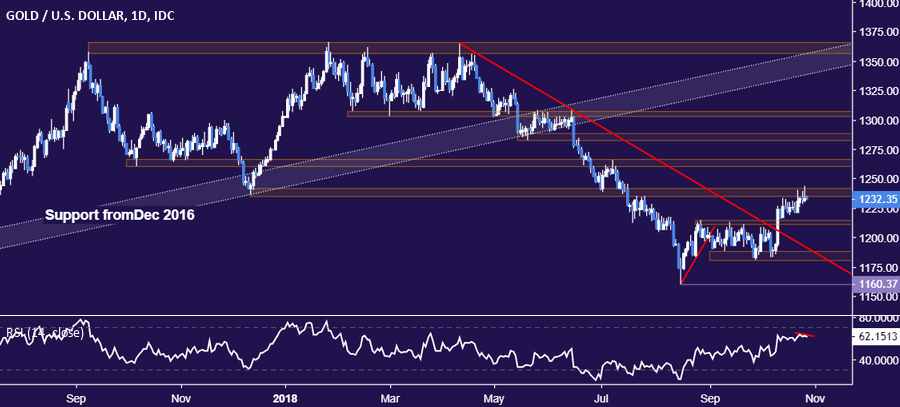
GOLD TECHNICAL ANALYSIS
Gold prices are still stuck below resistance in the 1235.24-41.64 area, with negative RSI divergence hinting a move lower may be brewing ahead. A breach below support in the 1211.05-14.30 zone exposes the September 28 low at 1180.86. Alternatively, a push through resistance targets the 1260.80-66.44 region.
CRUDE OIL TECHNICAL ANALYSIS
Crude oil prices rose to retest support-turned-resistance set from early February but the near-term down move remains intact. A push above 68.81 opens the door for a retest of the 70.05-26 area. Alternatively, a reversal back below the October 23 low at 65.77 targets the 64.26-45 region.
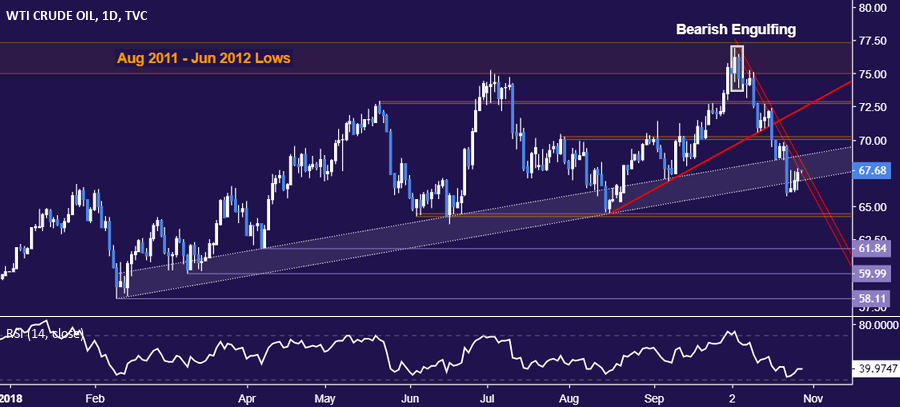
Turning to longer-term positioning, a major top appears to be in place as expected. A double top marked by the appearance of two bearish Evening Star candlestick patterns on the weekly chart has been confirmed with a break of the uptrend set from June 2017. The next layer of substantive support is in the 63.62-64.45 zone.

COMMODITY TRADING RESOURCES
- Learn what other traders’ gold buy/sell decisions say about the price trend
- Having trouble with your strategy? Here’s the #1 mistake that traders make
- Join a Trading Q&A webinar to answer your commodity market questions
--- Written by Ilya Spivak, Currency Strategist for DailyFX.com
To contact Ilya, use the comments section below or @IlyaSpivak on Twitter


