


Technical Forecast for Crude Oil: Neutral
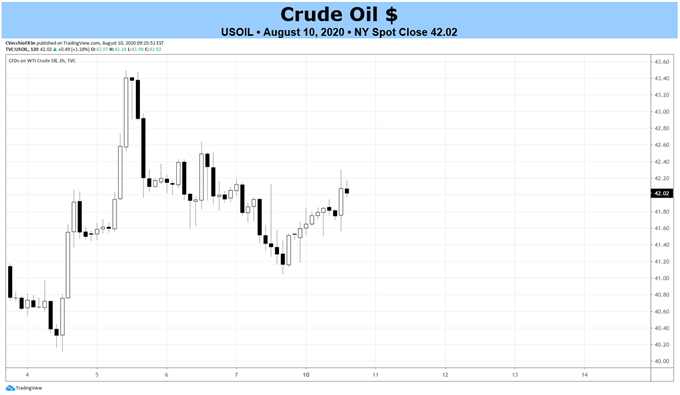
- Crude oil prices have been rather quiet in recent weeks, with the four-week ATR falling to its lowest level since the last week of December.
- The supply-demand deficit continues to be the predominant driver of energy markets, with price action constrained by coronavirus pandemic fears.
- The IG Client Sentiment Index suggests that crude oil prices have a bullish outlook.

Crude Oil Prices Week in Review
Last week, crude oil prices posted their best gain in over a month, adding +2.7%. The most recent episode where crude oil prices gained at least +2.7% came during the week of June 15, when oil gained +8%. It has been a trendless market, with crude oil prices alternating between gains and losses each of the past four weeks, and meandering around the same levels that they have since the end of June.
Economic Calendar Week Ahead Impact on Crude Oil Prices
As the calendar turns through the middle of August, it should not be dismissed that the ongoing improvement in global economic data ex-North America has proven to be a positive influence on crude oil prices. Evidence that Asia and Europe continue to rebound will only help buoy energy markets (even if those regions consume Brent oil rather than crude oil). Forward looking data is king, whereas backwards looking data (like Q2’20 UK GDP or Q2’20 Eurozone GDP, for example) carry less and less weight.
As such, outside the US, however, despite there being several major data releases (August RBNZ rate decision, July Australia jobs report, for example), none pique our interest with respect to potential impact on energy markets.
It still holds that, given the changing nature of energy production and demand as the global economy emerges from The Great Lockdown, we’ll want to keep on the EIA inventory data due to be released at 14:30 GMT on Wednesday, August 12. The data will continue to support our thesis that we’re in the beginning innings of a long ballgame where there will be persistent supply-demand deficits – for the next several quarters, if not years.
Crude Oil Price Chart – Daily Timeframe (August 2019 to August 2020) (Chart 1)
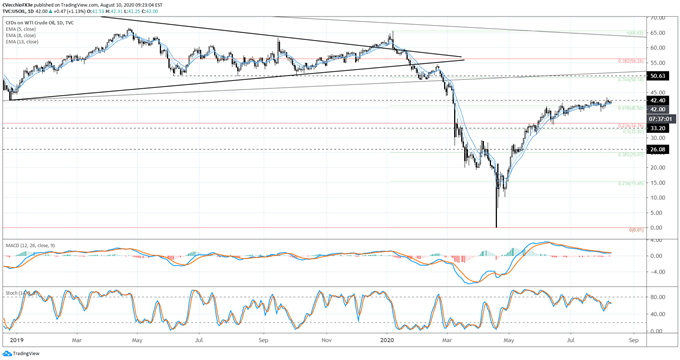
On the USOIL CFD contract, the low established during the May WTI contract moving into negative territory was 0. To this end, the Fibonacci retracement taken from the 2020 high at 65.62 to the contract low at 0 suggests that crude oil prices are trading just above the 61.8% retracement (40.56) of the 2020 trading range. Furthermore, crude oil prices are challenging the 2018 low at 42.40.
Around these levels, crude oil price momentum has moderated. Both daily MACD and Slow Stochastics are in bullish territory, but declining from overbought territory. The difference between the daily 5-EMA and the daily 21-EMA remains less than 2%, further evidence that momentum is lacking.
The key moving average to watch is the daily 21-EMA: but for July 30 and July 31, crude oil prices have closed above the daily 21-EMA every day since April 30, failure below said moving average would increase the likelihood of a shift lower by crude oil prices (although given the false breakdown at the end of July, other evidence will be required).
Crude Oil Price Chart – Weekly Timeframe (August 2019 to August 2020) (Chart 2)
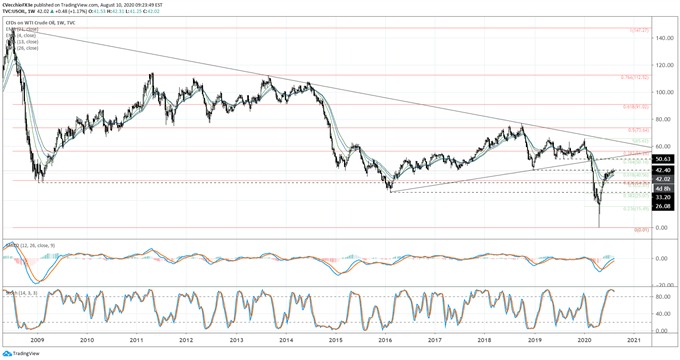
The longer-term chart of the USOIL CFD contract shows an impressive recovery from the coronavirus pandemic lows, but still suggests that technical difficulties remain. The losses around the coronavirus pandemic saw the 11-year symmetrical triangle yield a downside breakout, and crude oil prices have only recently started to recover in a meaningful manner. Marking a Fibonacci retracement using the high (2011) and low (2020) of the past decade, crude oil prices are trading between the 23.6% retracement (34.76) and the 38.2% retracement (56.26).
With the lowest four-week ATR since the end of December 2019 – a period when volatility across markets declines, as traders take vacations between Christmas and New Year’s – it holds that traders should not be expecting anything exciting out of crude oil markets at present time. For now, the tedious trading conditions remain in place.
IG Client Sentiment Index: Crude Oil (August 10, 2020) (Chart 3)
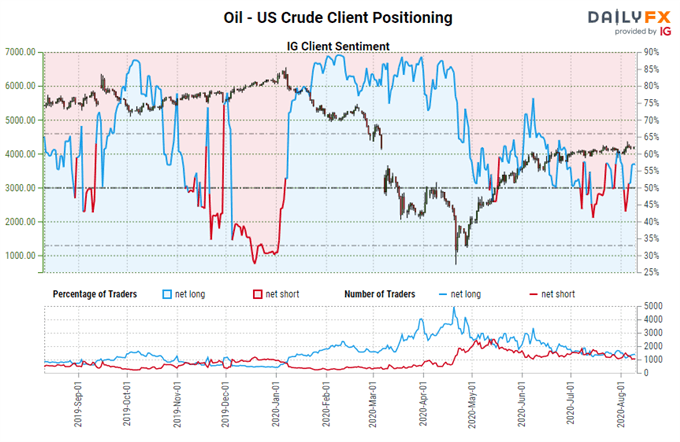
Oil - US Crude: Retail trader data shows 56.68% of traders are net-long with the ratio of traders long to short at 1.31 to 1. The number of traders net-long is 5.35% higher than yesterday and 10.49% lower from last week, while the number of traders net-short is 7.63% higher than yesterday and 6.78% lower from last week.
We typically take a contrarian view to crowd sentiment, and the fact traders are net-long suggests Oil - US Crude prices may continue to fall.
Yet traders are less net-long than yesterday and compared with last week. Recent changes in sentiment warn that the current Oil - US Crude price trend may soon reverse higher despite the fact traders remain net-long.
Latest COT Data Shows Oil Longs Ease
Finally, looking at positioning, according to the CFTC’s COT for the week ending August 4, speculators sharply increased their net-long Crude Oil positions to 536.3K contracts, slightly up from the 532.6K net-long contracts held in the week prior. This is an improvement off of a three month low. Crude oil net-long positioning remains far below the highs seen over the past two and a half years, when 739.1K net-longs were held during the week ending February 6, 2018.
--- Written by Christopher Vecchio, CFA, Senior Currency Strategist


