


US Elections’ FX Market Impact: Losers
- Both the DXY Index and gold prices have exhibited weakness in the wake of the US presidential election results.
- The US political and vaccine development news over the past few weeks have been extremely bearish for safe haven assets, a category in which both gold and the US Dollar find themselves.
- The IG Client Sentiment Index is bearish towards both gold and the US Dollar (vis-à-vis EUR/USD, GBP/USD, and USD/JPY positioning).
Biden Win Changes Tone of Gridlock
Democrat Joe Biden has won the US presidency.The composition of Congress may be more important for financial markets, however. A divided Congress, in which Republicans control the Senate and Democrats control the House, likely means that the most aggressive stimulus scenarios are off the table in the near-term.
Coupled with news that coronavirus vaccine development is rapidly moving towards widescale distribution, financial markets are finding themselves in quite the ‘goldilocks’ scenario: the US economy is regaining its long-term economic potential; the lack of a ‘blue wave’ means no significant changes to corporate tax rates; and the near-termeconomic outlook remains uncertain enough to keep the Federal Reserve on the low rate path through 2023.
These factors have proven a potent mix for risky assets and a poisonous mix for the safe havens. Unfortunately for both gold prices and the US Dollar, they find themselves part of this latter category, making them clear losers as a result of the 2020 US presidential election.

Recent Developments Bearish USD, Bearish Gold
Alongside the news that COVID-19 vaccinesare reaching promising milestones in their development, optimism has been abound and growth-linked and riskier currencies have been outperforming. Hope that the United States will soon be able to wrangle control of the coronavirus pandemic through widespread vaccination has investors ignoring otherwise alarming COVID-19 outbreak data.
The developments over the past few weeks have been fundamentallylong-term bearish for the US Dollar and gold prices. The US Dollar has been plagued by low rates and a shift towards ‘the carry trade,’ whereby currencies with higher interest rate expectations are favored over lower yielding currencies.
But unlike mid-2020, when US real yields were falling, they are now rising on the back of an improved long-term economic outlook, which has lifted inflation expectations. It’s just that real yields are rising faster elsewhere, e.g. Australia, Canada, and New Zealand. Meanwhile, a rising US real yield environment, alongside real yields rising elsewhere, is bad for gold prices, plain and simple.

DXY Index Price Technical Analysis: Daily Chart (November 2019 to November 2020) (Chart 1)
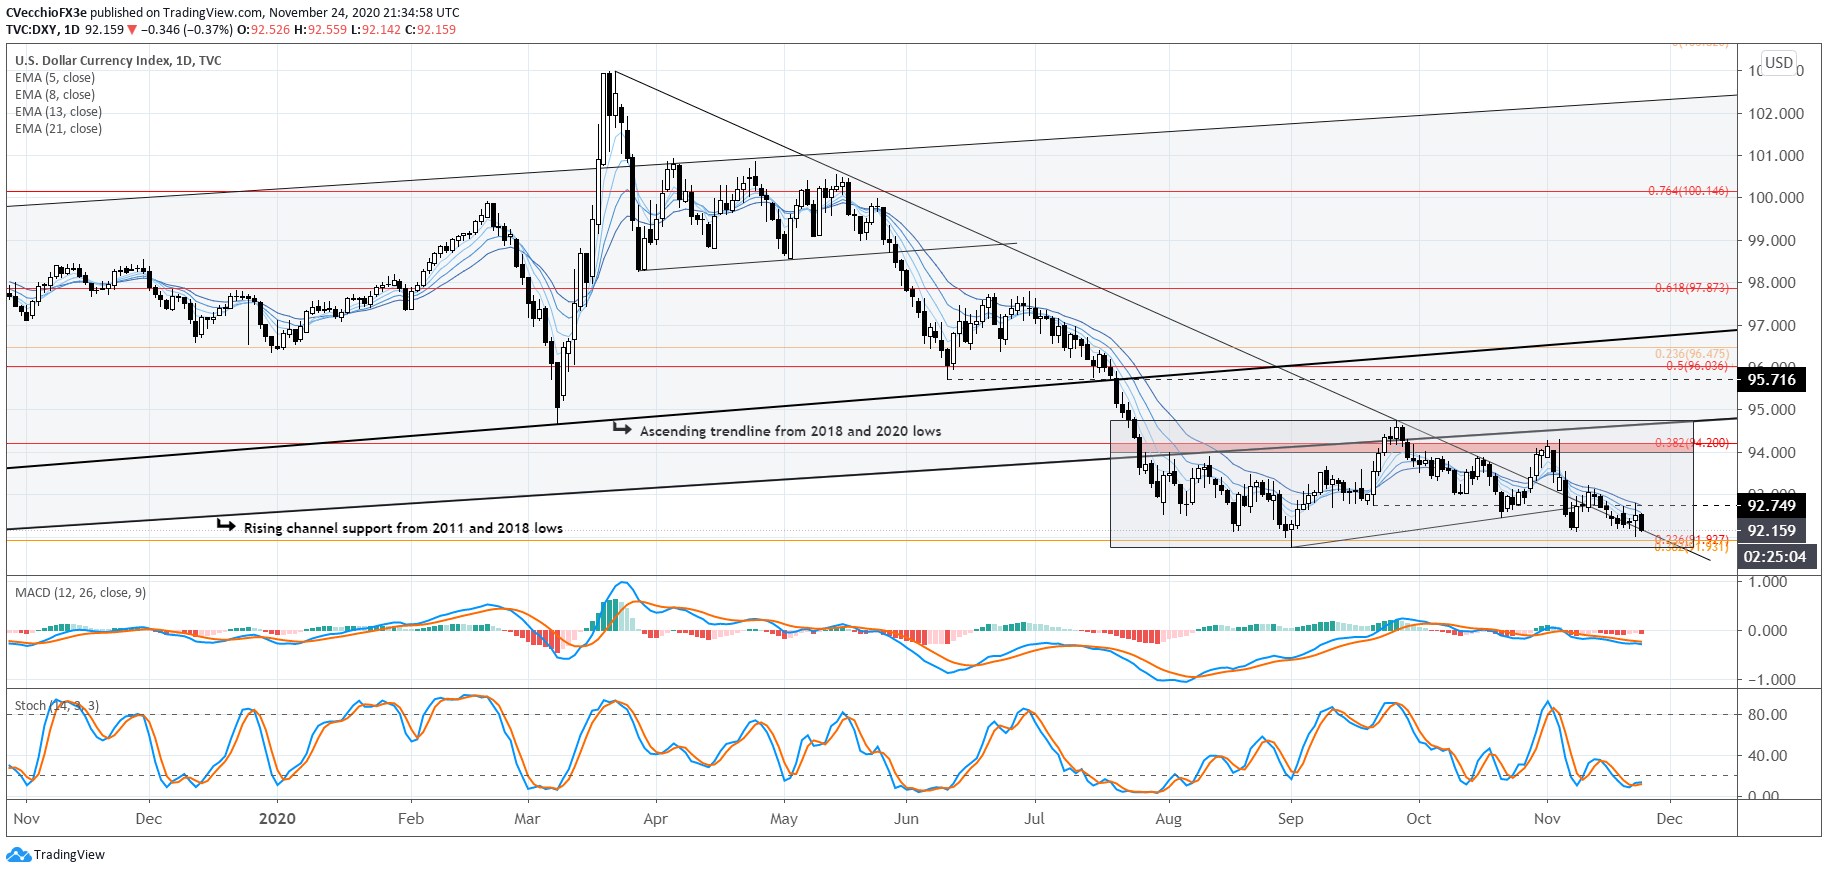
The US Dollar remains near support in its multi-month range; our outlook remains consistent with the update from Friday, November 20. “Since late-July, the trend has been predominately sideways, with a clear range carved out between 91.75 and 92.74 (mirroring the move in EUR/USD rates, the largest component of the DXY Index).”
Bearish momentum continues to set the tone, with the DXY Index holding below the daily 5-, 8-, 13-, and 21-EMA envelope, which is in bearish sequential order. Daily MACD is trending below its signal line, while Slow Stochastics are holding in oversold territory.
While it remains true that “until the range breaks, the DXY Index is simply playing pong,” traders may want to be on alert for a break of 91.75 during the second half of this Thanksgiving holiday week – thin liquidity can lead to sharp moves (even if they don’t have staying power).
DXY Index Price Technical Analysis: Weekly Chart (November 2019 to November 2020) (Chart 2)
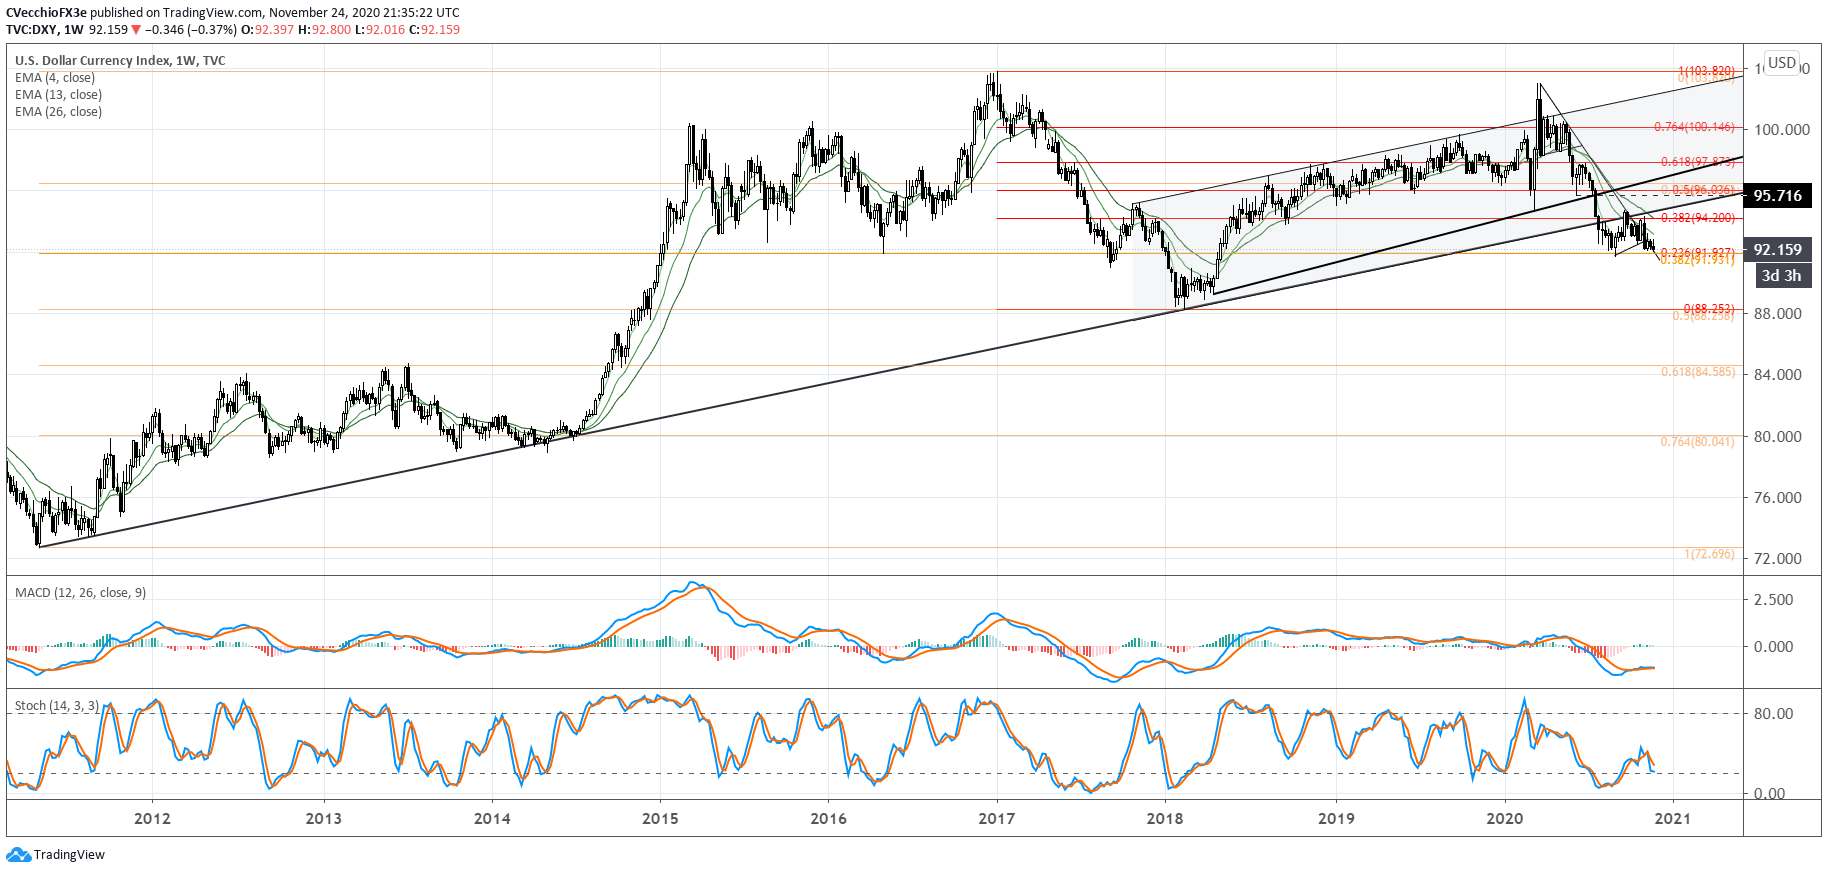
The DXY Index is pacing for its second consecutive weekly loss for the first time since the last week of September and the first week of October. Still, the sideways range the DXY Index has found itself trapped within since late-July retains technical primacy. As the DXY Index hugs the downtrend from the March and May swing highs, time is running out before said trendline meets the multi-month range support near 91.75, the yearly low.
It still holds that “the 94.00/20 area has been a dynamic band of support/resistance since late-July, suggesting that were the DXY Index to overcome this hurdle, there may be greater confidence of a narrative-shattering and short covering rally developing.” Below 91.75 (yearly low), and the DXY Index could quickly see losses accelerate.

Gold Price Technical Analysis: Daily Chart (November 2019 to November 2020) (Chart 3)

The US elections outcome is perhaps the worst case scenario for gold prices. As a result, gold prices have traded through significant technical support levels in recent months, suggesting that a near-term top has been confirmed. The prior falling wedge interpretation has been invalidated. Gold prices have fallen to their lowest level since mid-July, clearing out the August swing low near 1818.09 in the process.
At present time, gold price momentum is bearish – increasingly bearish, that is. Gold prices are below their daily 5-, 8-, 13-, and 21-EMA envelope, which is in bearish sequential order. Daily MACD is trending lower below its signal line, while Slow Stochastics are comfortable in oversold territory. More losses look imminent.
Gold Price Technical Analysis: Weekly Chart (October 2015 to November 2020) (Chart 4)

It’s been previously noted that “a loss of the August low at 1862.90 would be a very important development insofar as redefining the recent consolidation as a topping effort rather than a bullish continuation effort…failure to stay above the descending trendline from the August and September swing highs would suggest that the next leg higher is not beginning.”
Indeed with the 38.2% Fibonacci retracement of the 2020 low/high range at 1836.97 breaking as well, the weekly charts are suggesting that a near-term top has been established. Further losses towards the 50% Fibonacci retracement of the 2020 low/high range at 1763.36 can’t be ruled out.

IG CLIENT SENTIMENT INDEX: GOLD PRICE FORECAST (NOVEMBER 24, 2020) (CHART 5)
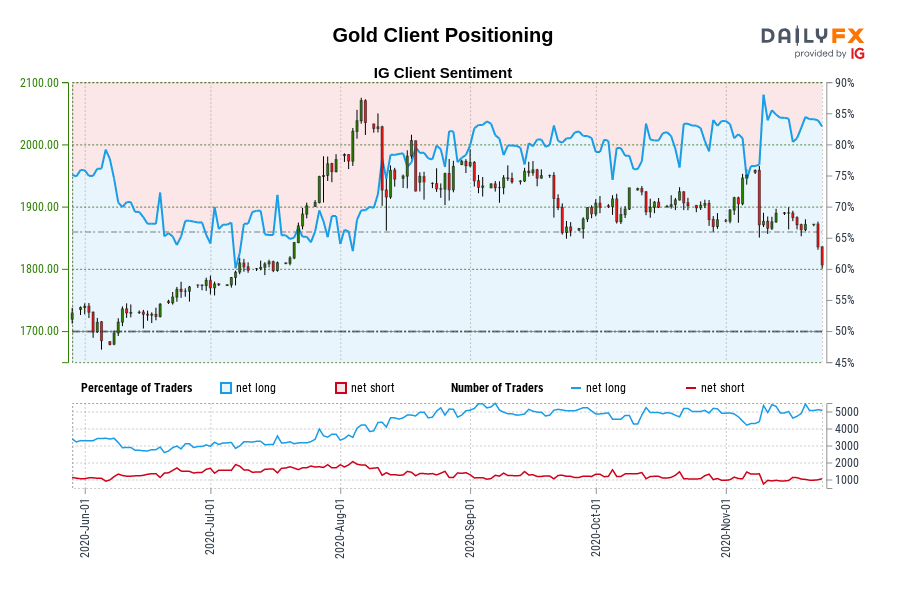
Gold: Retail trader data shows 82.61% of traders are net-long with the ratio of traders long to short at 4.75 to 1. The number of traders net-long is 4.27% higher than yesterday and 9.02% higher from last week, while the number of traders net-short is 7.01% higher than yesterday and 6.63% lower from last week.
We typically take a contrarian view to crowd sentiment, and the fact traders are net-long suggests Gold prices may continue to fall.
Positioning is less net-long than yesterday but more net-long from last week. The combination of current sentiment and recent changes gives us a further mixed Gold trading bias.
Read more: Winners in FX Markets After US Presidential Election: CAD & MXN
--- Written by Christopher Vecchio, CFA, Senior Currency Strategist


