
US STOCKS OUTLOOK:
- S&P 500 drops 16.4% during the second quarter, heads to the third quarter in bear market territory
- The Nasdaq 100, for its part, sinks 22.5% amid broad-based tech sector weakness
- The macroeconomic environment will likely become more challenging for stocks in the near-term, preventing a meaningful and sustainable recovery
Trade Smarter - Sign up for the DailyFX Newsletter
Receive timely and compelling market commentary from the DailyFX team
Most Read: US Dollar Price Action Setups - EUR/USD, GBP/USD, USD/CAD, USD/JPY
Today marked the end of the second quarter and the first half of the year. Both periods were disastrous for U.S. stocks on the back of extremely bearish sentiment and growing headwinds for the economy, including soaring inflationary pressures, rapidly slowing growth and higher borrowing costs for consumers and businesses.
When it was all said and done and after dizzying price swings, the S&P 500 plunged 16.4% in the second quarter, erasing more than $6 trillion in market capitalization. The Nasdaq 100, for its part, led the sell-off on Wall Street, plummeting 22.5% amid broad-based tech sector weakness. The following table summarizes the performance of the main U.S. equity indices.

Source: DailyFX and Bloomberg
The brutal rout came as the Federal Reserve launched one of its most aggressive hiking campaigns in recent times to tame inflation, now sitting at the highest level in more than four-decades. The forceful actions by policymakers, who waited too long to begin removing accommodation and then had to front-load interest rate increases, have tightened financial conditions considerably, fueling fears that the U.S. economy is headed for a hard landing. It is difficult to say with certainty whether the worst predictions will materialize, but the downturn narrative is growing stronger by the day.

Recent data have supported some of the bearish arguments. For instance, first-quarter U.S. gross domestic product contracted 1.6% amid softening personal consumption expenditures, which grew at an anemic rate of 1.8%, a below-trend increase that suggests the consumer health is deteriorating quickly due to falling real incomes and stressed budgets. Based partially on this information, it appears the U.S. economy is teetering on the brink of a recession, a scenario that will bode ill for corporate profits.
Looking ahead, there aren’t a lot of reasons to be optimist yet. Having said that, the investment landscape could get worse before it gets better heading into the second-quarter reporting season, a period when companies could begin to cut their earnings outlook for the year in response to the more hostile business environment. Should this bearish scenario play out, Wall Street could be in for more pain and, of course, heightened volatility.
| Change in | Longs | Shorts | OI |
| Daily | 1% | -1% | 0% |
| Weekly | 15% | -13% | -1% |
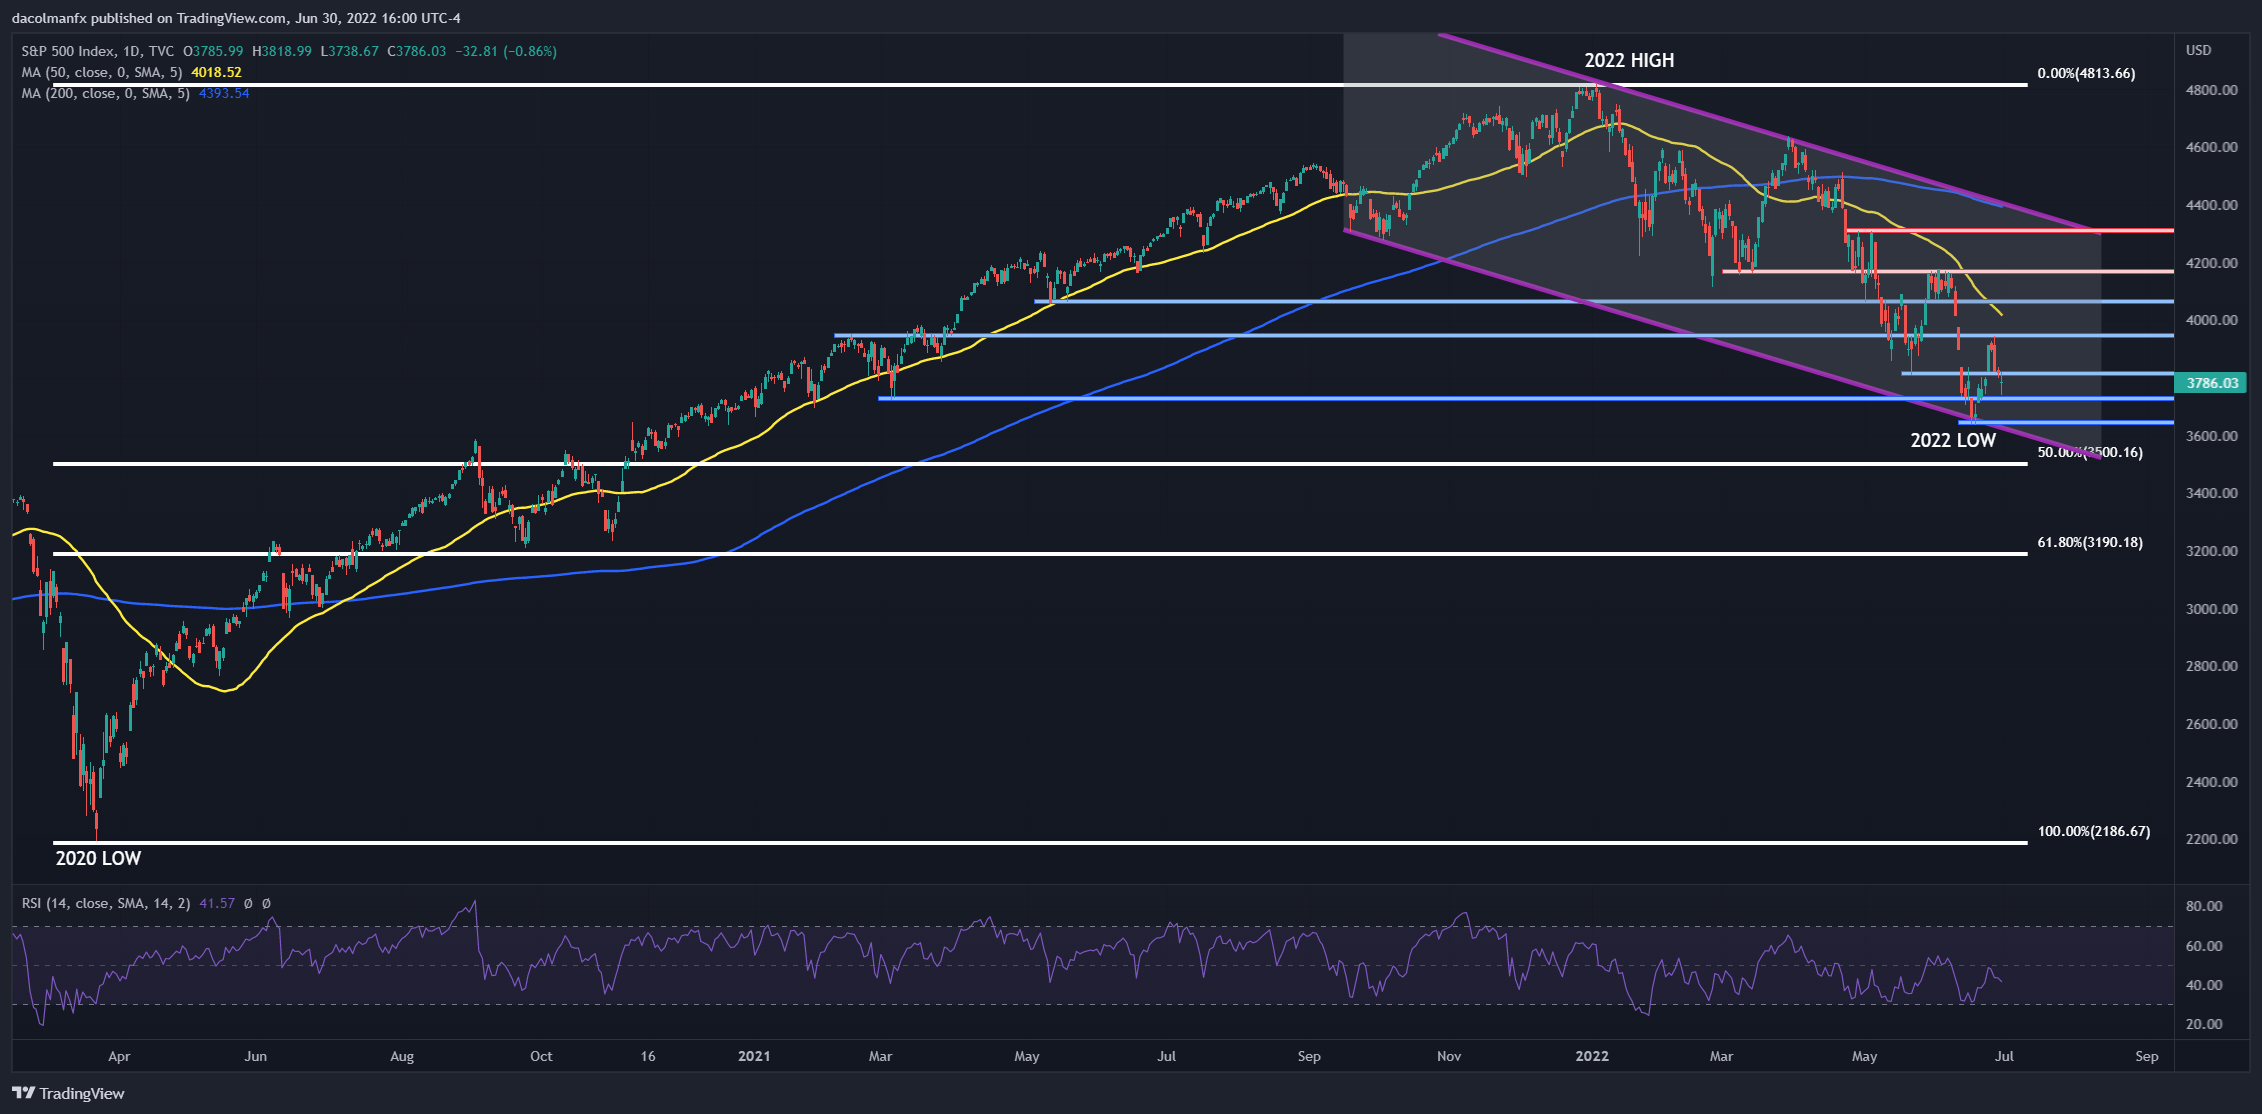
S&P 500 TECHNICAL ANALYSIS
The S&P 500 ended the quarter in bear market, slightly below the 3,800 area. For now, the technical signals remain negative, suggesting we could see more weakness in the coming days and weeks. In the event of more losses, the focus shifts to 3,730, followed by the 2022 lows near 3,620. On the other hand, if buyers retake decisive control of the market and manage to spark a rebound, initial resistance comes at 3,940/3,950. If we see a break here, bullls could launch an attack on the 50-day SMA and 4,060 thereafter.
S&P 500 TECHNICAL CHART