


Dow Jones Industrial Average, S&P 500, VIX, Recession Risk, EURUSD and USDJPY Talking Points:
- The Trade Perspective: S&P 500 Bearish Below 4,075; USDJPY Bearish Below 134.00; Bullish EURUSD Above 1.0635
- The strong rebound from risk benchmarks like the S&P 500 and Dow Jones Industrial average turned this past session, threaten to break seasonal norms and revive a strong dominant trend
- While recession represents the greatest risk in my book going forward, the abstract theme is likely to take a back seat to rate speculation for volatility
A Troubling Spill Before What is Supposed to be a Peaceful Holiday Weekend
Risk assets took a turn for the worst this past session, though I’m not yet confident that the restoration of a dominant trend loaded with a number of systemic threats will be able to override the anticipation of seasonality. The retreat in ‘risk’ was broad this past session – which goes a long way to establishing its conviction – but the US indices remain my preferred measure of convenience. The S&P 500 reversed its brief opening charge to close -2.0 percent lower on the day, pushing the benchmark back below the original ‘bear market’ technical threshold at 3,836. There are plenty of subsequent support levels to track for establishing deeper conviction in a reversal via SPX, but the speculative tipping point for me remains the Dow Jones Industrial Average. The value index slipped 31,000 through this past session’s close with a steady slide that ended near the day’s lows. The true tipping point that can cause serious upheaval however would be the 29,562 designation (on my chart) which is the official -20 percent correction mark from all time highs. In other words, that is where this stalwart of investor appetite and the most recognizable US index globally would find is name smeared with ‘bear market’ in the headlines.

Chart of Dow Jones Industrial Average with 20-Day SMA (Daily)
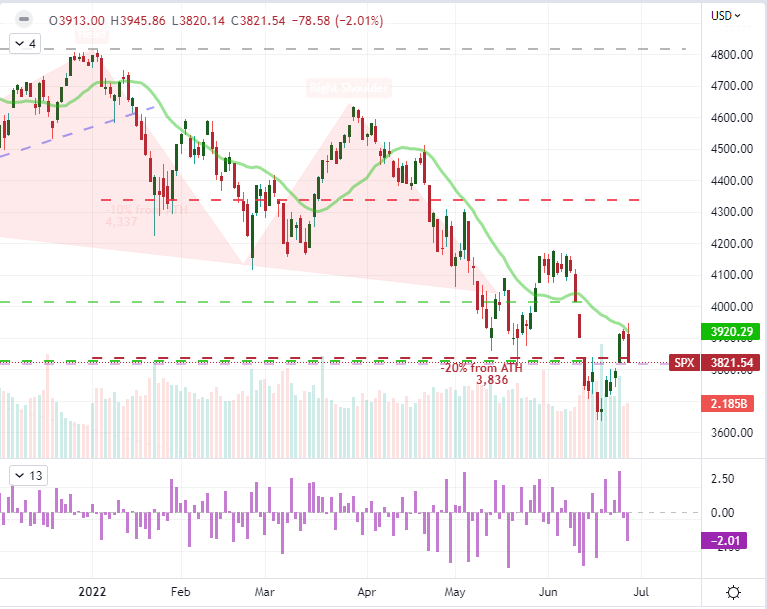
Chart Created on Tradingview Platform
While I believe that the prevailing winds behind the S&P 500 and other risk-leaning markets in 2022 is bearish; there is a strong, immediate impediment to seeing that potential catalyzed now. We are traversing one of the most reserved weeks of the in terms of volatility of the year. In fact, VIX averages the third most quiet week of the year through week 26 (which we are currently in) and the subsequent week is the absolute lull. Further, the S&P 500’s weekly breakdown shows historically that week 27 is the second best performance on this periodicity, behind only the opening week of the year. There is a lot of assumption built in the market’s view of what is possible. Even if the consensus was bearish, could the curb on activity keep that theme from progressing for the immediate time being?
Chart of Weekly Seasonal Performance of VIX Volatility Index
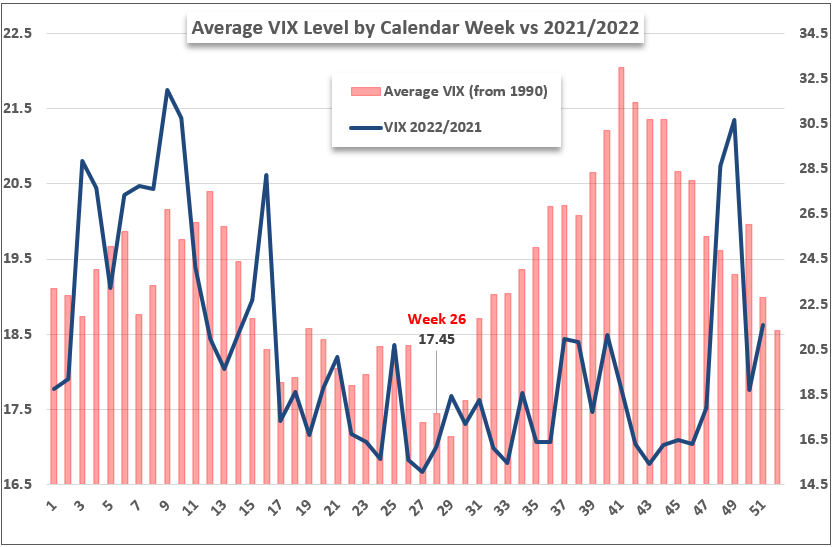
Chart Created by John Kicklighter with Data from
The Fight Between Seasonal Restraints and Structural Problems
If we were trading through ‘normal’ conditions, I would see a greater probability that this turn could amplify trend and capture more significant moment. However, expectations of this tempered volatility along with expectations of ‘summer doldrums’ starting next week with July representing the lowest month for S&P 500 volume make it a difficult environment in which to gain serious traction. That said, it is not at all impossible. While week 26 for the VIX, week 27 for the S&P 500 and the month of July for volume all average out to their extraordinary levels; there are always exceptions to the rule. I will point out once again that the VVIX – the volatility of volatility index – has once again dove, this time to levels not seen since the end of 2019. This is ‘too quiet’ given our circumstances and stands as a contrarian indicator – though only a contribution and not the definitive backdrop.
Chart of VVIX Volatility of Volatility Index Overlaid with the S&P 500 (Weekly)

Chart Created on Tradingview Platform
The fundamental event risk and its ability to tap into larger themes is where the capacity to override inertia would arise. There seems far more ambiguity moving forward around the state of economic health and the distinct concern around recessions, but that is a slow rolling avalanche with not many definitive catalysts through the immediate future. If anything, Thursday and Friday pose the most capable data between the Chinese PMIs, US personal spending, Japan capital expenditures and the US ISM manufacturing report. Collectively, these readings could make an impression but the holiday weekend gravity will be strong. For Wednesday’s session specifically, my attention will be on interest rate speculation as a driver – and that is more of a relative influence at the moment. This past session, the probability of a 75bp rate hike from the Fed in July and September slid; but the collective statements due from the FOMC’s Powell, ECB’s Lagarde and BOE’s Bailey could offer up an important overview.
Calendar of Major Global Economic Events

Calendar Created by John Kicklighter
The Top Dollar Pairs Remain Among My Top ‘Watchlist’ Assets
Recession risks and interest rate disparities remain critical influences when it comes to USDJPY, but I still believe that this cross – as with most Yen pairs – is more distinctly a ‘risk’ bellwether. I maintain serious skepticism over the Bank of Japan’s ability to pursue monetary policy that is so divergent from its global counterparts and am observant of the warnings issued by local authorities about the possible need for intervention. That said, a strong revival of risk aversion would effectively send this pair into reversal. The further stability erodes and losses are tallied in investment assets, the stronger the urge by Japanese investors to repatriate their capital. While I may be watching the S&P 500 for its next move, my expression of any serious waves of risk aversion would more likely be pursued here.

Chart of USDJPY with 20-Day SMA and Net Speculative Futures Positioning(Daily)

Chart Created on Tradingview Platform
Finally, since we are looking at more interest rate speculation over the immediate future, I’m turned back to EURUSD. Overall, the Dollar is in a more yield intensive position; but that has more or less been priced into the exchange rate testing multi-decade lows. This past session, the probability of a 75bp hike on July 27th from the FOMC dropped to 86 percent from 96 percent from a week ago. Further, the chances of another 75bps worth of tightening on September 21st (a collective 150bps over two meetings) is down to 26 percent from 46 percent a week prior. Further softening of the Fed’s potential could offer EURUSD lift, but a true break of 1.0635 (much less 1.0800) would need to be fueled by the ECB committing to a faster tightening in the second half. Perhaps the conclusion of the ECB central bank forum will bring that kind of closer coordination towards hawkish policy?

Chart of EURUSD Overlaid with German-US 2-Year Yield Differential (Daily)
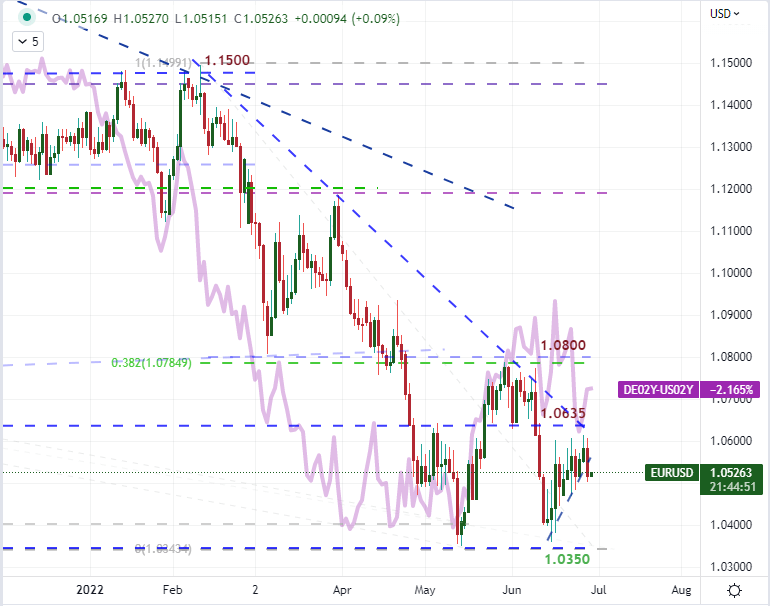
Chart Created on Tradingview Platform


