


US STOCKS OUTLOOK:
- Nasdaq 100 plunges as tech stocks sell off
- Snap’s profit warning spook markets, prompting investors to cut exposure to social media companies
- Weak U.S. economic data exacerbates negative sentiment
Trade Smarter - Sign up for the DailyFX Newsletter
Receive timely and compelling market commentary from the DailyFX team
Most Read: Cathie Wood & Ark: Insiders Aren’t Buying the Hype
After a brief reprieve at the start of the week, U.S. tech stocks resumed their decline on Tuesday, weighed down by a brutal sell-off in the social media universe. At the closing bell, the Nasdaq 100 plunged 2.2% to 11,769, well off the session’s worst levels when it came very close to retesting its 2022 lows.
Strong downside pressure began yesterday evening after Snap, Snapchat's parent company, posted worse-than-expected quarterly results and issued a negative profit warning, indicating it would miss its own performance targets on cooling ad revenues, blaming the setback on the deteriorating macroeconomic environment. The warning dragged social media companies across the board on fears that the slowdown in digital advertising would also affect their bottom-lines. As for the worst performers in the space, Snap plummeted 43%, Pinterest cratered 23.64%, Meta tumbled 7.62% and Twitter lost 5.5%.
The equity rout was compounded by disappointing U.S. economic data. May manufacturing activity slowed, but the most worrisome sign came from the services PMI, which notched its weakest expansion in four months. To make matters worse, April new home sales plunged 16.6%, a sign that the real estate segment is decelerating rapidly amid soaring mortgage rates. These reports generated a strong risk-off response on Wall Street, boosting U.S. bond prices and weighing on yields.

Looking ahead, the macroeconomic landscape is becoming increasingly more challenging for stocks. Faced with soaring inflation, the Fed will have to continue raising borrowing costs in the coming months in order to restore price stability, even if that sparks a significant downturn. Justified or not, many investors fear that the current tightening cycle embraced by policymakers could lead to a recession, a scenario that will certainly complicate the outlook for Corporate America and their earnings.
Turning to the economic calendar, Wall Street's focus will be on April durable goods orders and the FOMC Minutes on Wednesday, but the highlight of the week will come on Friday with the April PCE report. With US markets closed next Monday for the Memorial Day holiday and traders starting to leave their desks for the long weekend, liquidity conditions could deteriorate further in the coming days. Thin liquidity could amplify price volatility if key economic data surprises on the upside or downside relative to expectations.

NASDAQ 100 TECHNICAL ANALYSIS
The Nasdaq 100 resumed its relentless drop on Tuesday, but fell short of retesting the 2022 lows near 11,492, a critical technical support area to watch. For sentiment to stop deteriorating and bearish pressure to abate, this floor must hold, but if breached, the focus would shift down to the November 2020 lows around 11,000. On the flip side, if dip buyers resurface and trigger a rebound, initial resistance appears at 12,250, followed by 12,600. On further strength, the next upside level of interest comes in at 13,000.
NASDAQ 100 TECHNICAL CHART
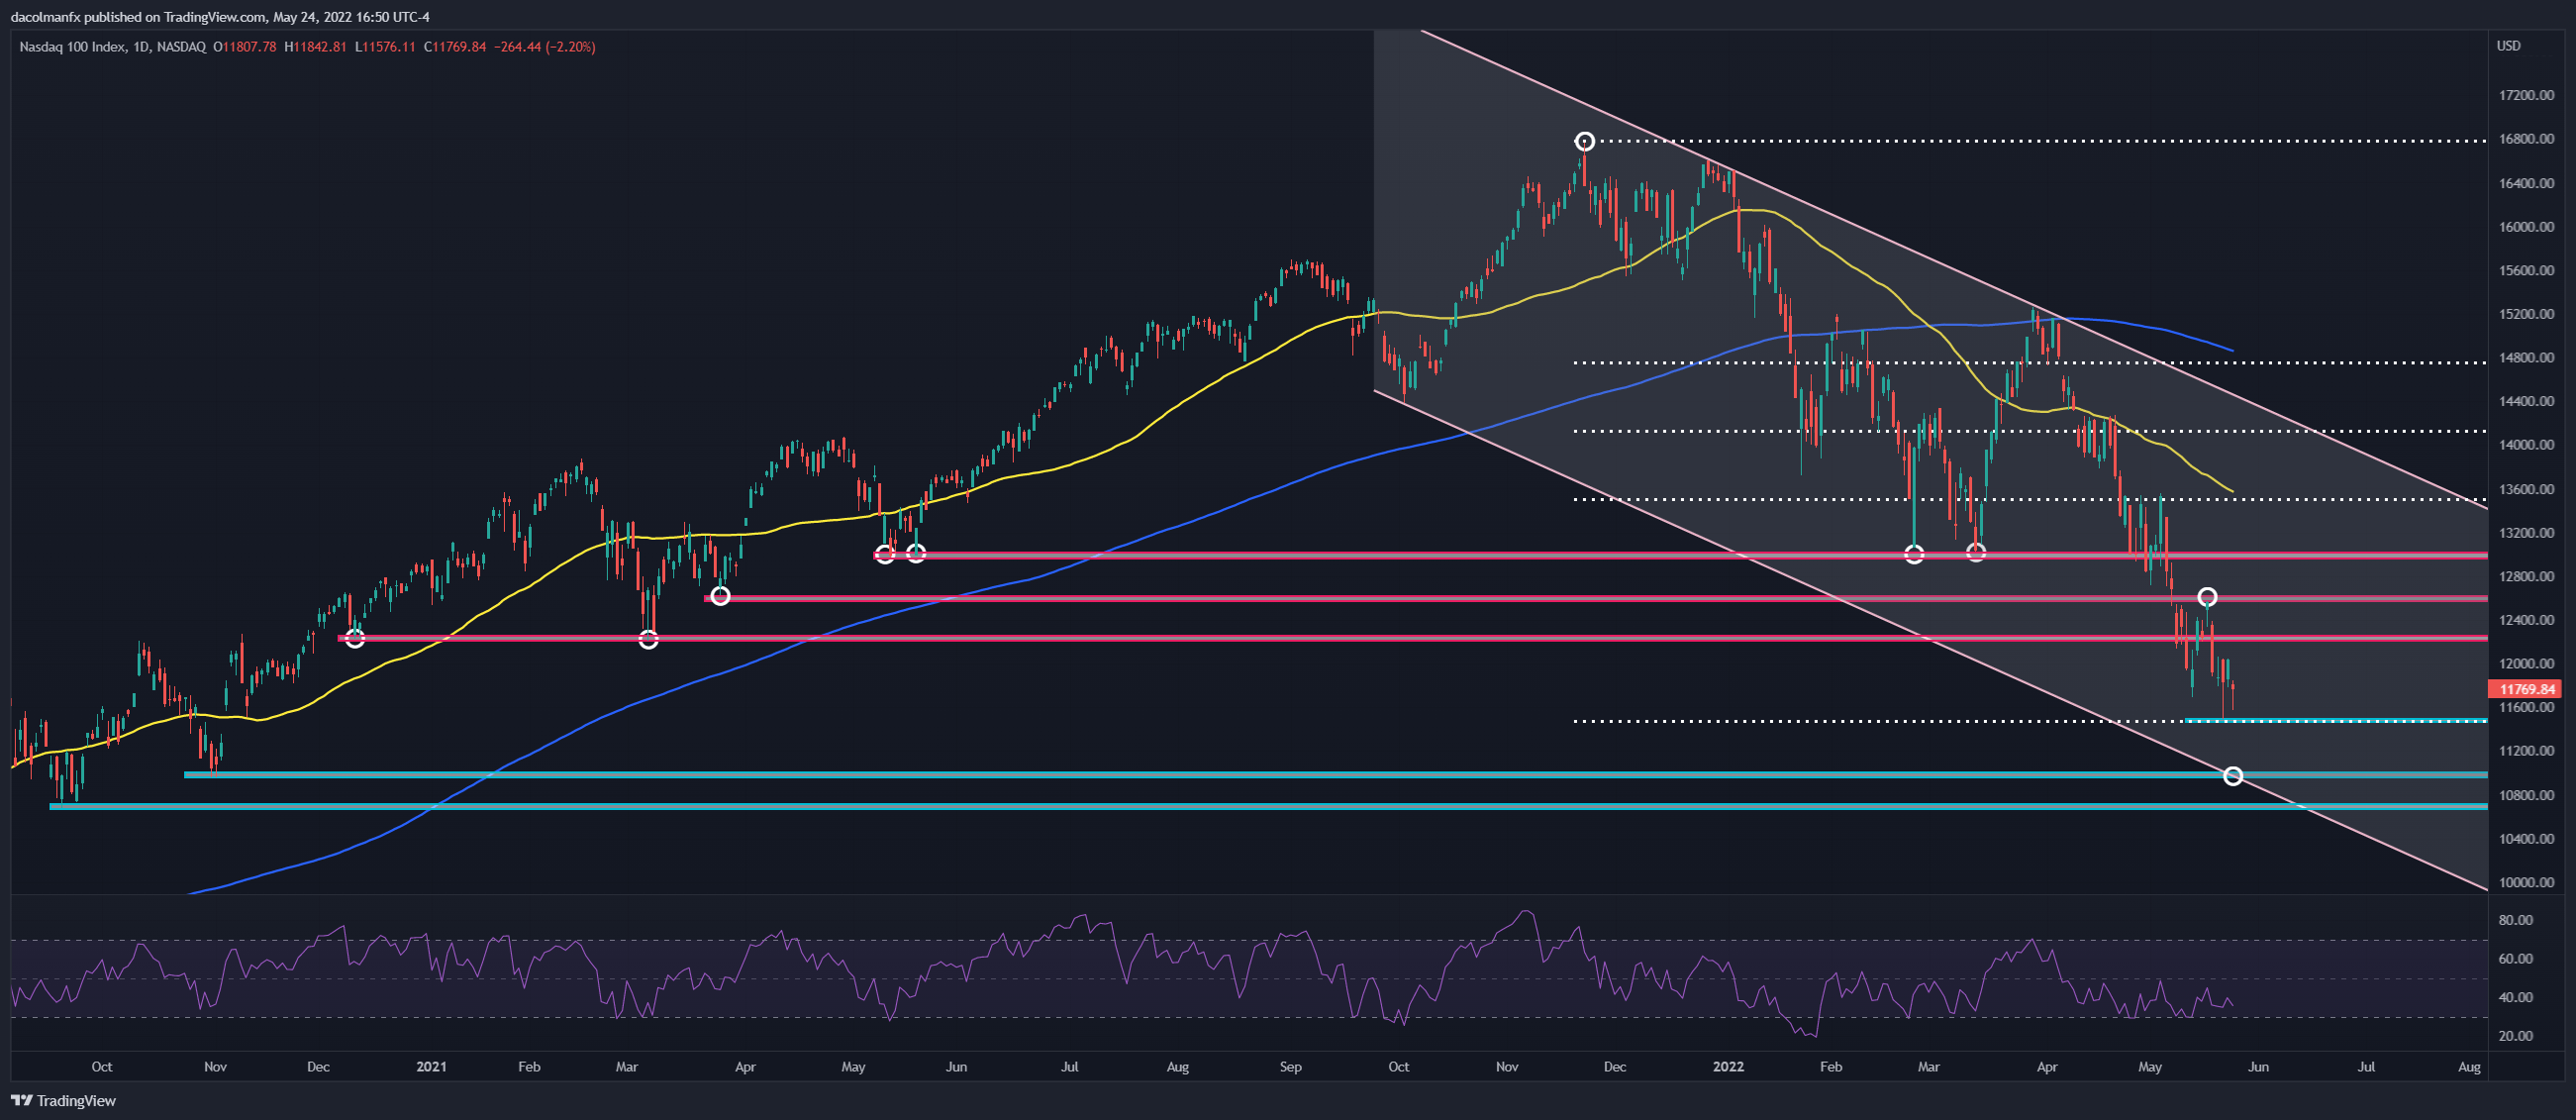
NASDAQ 100 Technical Chart Prepared Using TradingView
EDUCATION TOOLS FOR TRADERS
- Are you just getting started? Download the beginners’ guide for FX traders
- Would you like to know more about your trading personality? Take the DailyFX quiz and find out
- IG's client positioning data provides valuable information on market sentiment. Get your free guide on how to use this powerful trading indicator here.
---Written by Diego Colman, Market Strategist for DailyFX


