


US PMI KEY POINTS:
- US PMI Composite Output Index slows to 53.8 in May from 56 in April, hitting a four-month low
- Flash Services Business activity cools to 53.5 from 55.6 in the previous month, also a four-month low. Meanwhile, Manufacturing sector growth eases to 57.5 from 59.2
- S&P 500 extends losses as slowing economic growth raises questions about the health of the US economy
Trade Smarter - Sign up for the DailyFX Newsletter
Receive timely and compelling market commentary from the DailyFX team
Most Read: Nasdaq 100 Capitulates as Risk-off Mood Weighs Markets and ECB Signals Hikes
U.S. economic activity continued to cool in the second quarter, dampened by soaring price pressures, softening demand and deterioration in supplier delivery times. According to S&P Global, its Flash Composite Purchasing Managers’ Index, which combines manufacturing and services production data, fell to a preliminary reading of 53.8 in May from 56.0 last month, hitting its lowest mark since the start of the year when the omicron variant brought the recovery to a screeching halt. For general interpretation, any figure above 50 signals expansion while readings below that level indicate contraction.
Examining the results in more detail, the services PMI fell to 53.5 from 55.6 in April, disappointing expectations that had called for a more modest pullback to 55.2. Although demand conditions remained sturdy thanks to loosened pandemic restrictions, growth in the sector where most Americans work continued to moderate as a result of concerns over higher interest rates and consumers' reduced willingness to spend due to falling real incomes. Despite this deceleration, optimism among service sector firms increased on hopes that labor and supply shortages will ease and the retrenchment in customer demand will prove transitory.
Elsewhere, the May manufacturing PMI retreated to 57.5 from 59.2, in line with consensus expectations. It is true that the slowdown raises concerns, but the pace of growth remained solid on account of a steep rise in production and new orders, and afaster upturn in employment. Overall, the goods-producing sector, which accounts for roughly 12% of GDP, maintained a steady expansion, but confidence dropped to a seventh month low amid a significant increase in cost burdens.
MAY PMI DATA
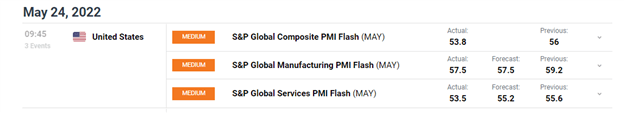
Source: DailyFX Economic Calendar
In summary, May PMIs suggest that U.S. economic activity is losing strength, but are still indicative of annualized GDP growth of approximately 2%, a sign that the economy is not about to go off the cliff as many Wall Street analysts predict. Healthy output expansion, solid employment numbers and unrelenting cost pressures for U.S. businesses suggest that the Federal Reserve will have to continue to removing policy accommodation over the coming months to meet its mandate. This may be problematic for risk assets, especially if GDP decelerates more than anticipated.
Immediately after the PMI survey crossed the wires, the S&P 500 extended session's losses, dropping more than 2% on the day. While the sharp sell-off is partly related to weakness in the technology sector triggered by Snap's poor outlook, the rapid slowdown in economic growth is also contributing to the negative sentiment.
S&P 500 5 MINUTE CHART
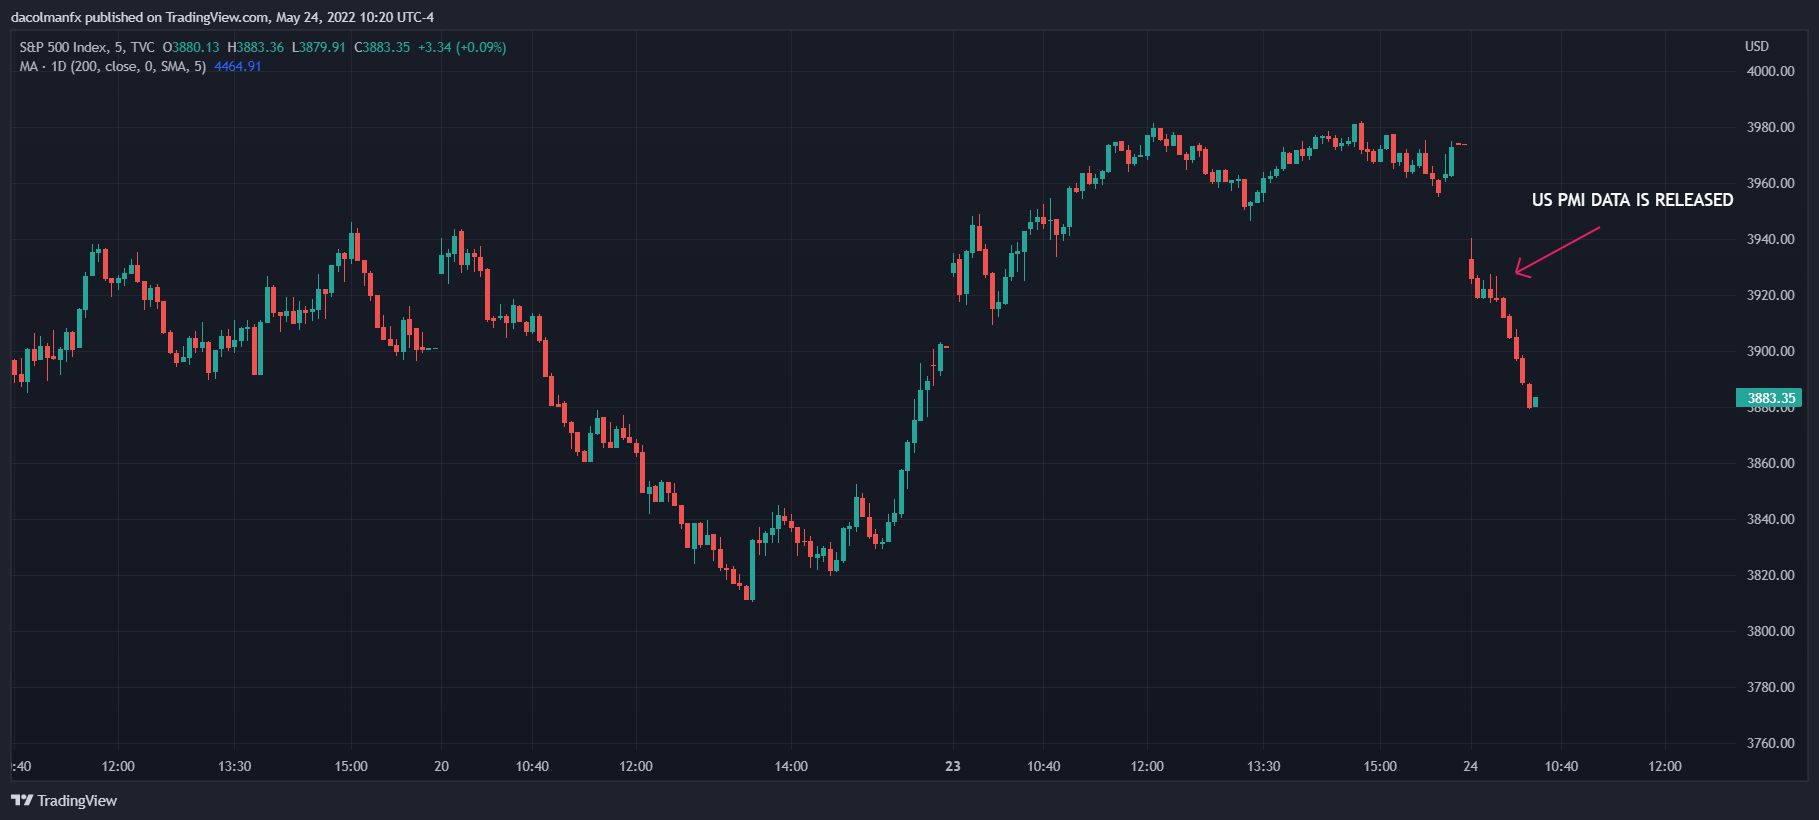
Source: TradingView
EDUCATION TOOLS FOR TRADERS
- Are you just getting started? Download the beginners’ guide for FX traders
- Would you like to know more about your trading personality? Take the DailyFX quiz and find out
- IG's client positioning data provides valuable information on market sentiment. Get your free guide on how to use this powerful trading indicator here.
---Written by Diego Colman, Market Strategist for DailyFX


