


Palladium Prices, Silver Outlook – TALKING POINTS
- XPD/USD broke below key inflection point – will follow-through lead to a selloff?
- Palladium prices have risen on virus-induced supply shock – but will it be enough?
- Silver prices rebound may be cut short as XAG/USD flirts with key inflection point
Palladium Prices Forecast
Palladium has struggled to recover from the over 40 percent drop after peaking at 2855.00, and may now be on the verge of suffering additional losses. XPD/USD bottomed out at the September 2019-low at 1596.00 and spiked over 20 percent. The fundamental catalyst behind the precious metal’s recovery may have had to do in large part from the prospect of virus-induced disruptions to key mining operations in South Africa.

XPD/USD – Daily Chart
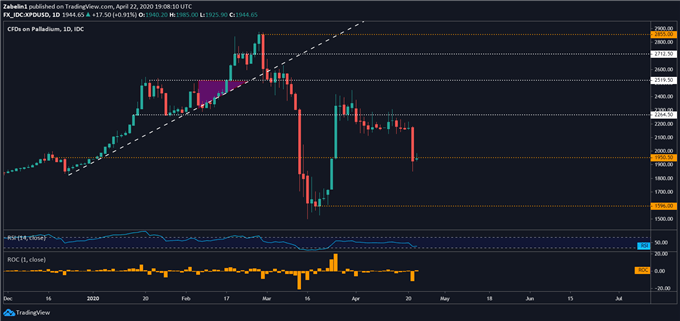
XPD/USD chart created using TradingView
This supply shock temporarily alleviated the downside pressure being exerted on the growth-anchored precious metal after the virus catalyzed a market-wide selloff in risk-oriented assets across the world. However, palladium recently suffered its biggest one-day loss on April 21 and is now trading below a key inflection point at 1950.50. If the breach is met with follow-through, XPD/USD may retest support at 1596.00.
XPD/USD – Weekly Chart
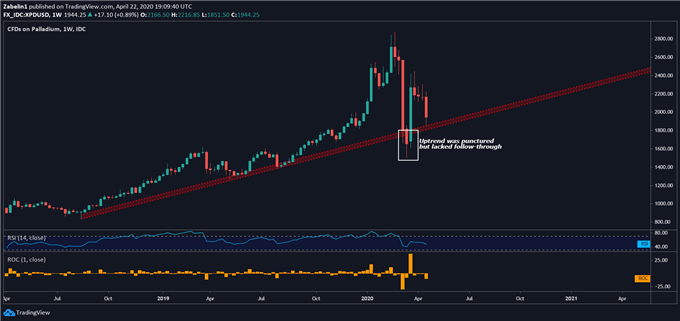
XPD/USD chart created using TradingView
Looking at a weekly chart, however, does show an cautiously optimistic outlook for palladium bulls. While XPD/USD punctured the two-year uptrend, it lacked follow-through and subsequently jumped up and is now trading above the rising support channel. Having said that, if the fundamental outlook continues to deteriorate beyond the baseline forecast, palladium prices could retest and shatter support, catalyzing what could be an aggressive selling bout.
Follow me on Twitter @ZabelinDimitri for more updates!
Silver Prices Outlook
After briefly trading in the compression zone between resistance at 18.476 and rising support, XAG/USD shattered the slope of appreciation and fell over 30 percent. However, selling pressure abated around 11-year lows and the pair bounced back after bottoming out at 12.653. However, price action may become more timid as XAG/USD approaches former support-turned-resistance at 16.541. Failure to clear it could lead to capitulation and heightened liquidation pressure.
| Change in | Longs | Shorts | OI |
| Daily | 3% | 2% | 3% |
| Weekly | 4% | -9% | 2% |
XAG/USD – Weekly Chart
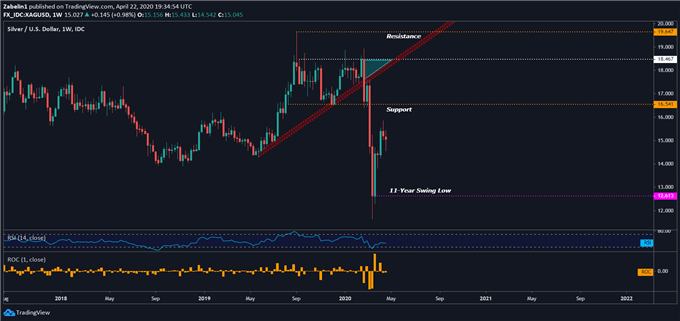
XAG/USD chart created using TradingView
Looking at a daily chart also shows a worrisome picture. Silver prices were up until recently climbing along a steep uptrend following their turnaround, and are now in danger of trading below a former descending resistance channel. If it breaks below it with follow-through, that could cast a bearish overhang and amplify selling pressure.
XAG/USD – Daily Chart
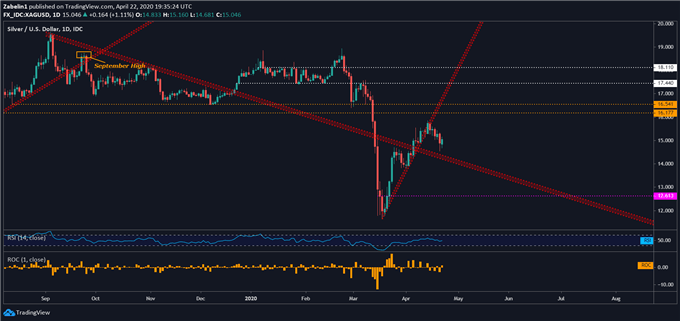
XAG/USD chart created using TradingView
--- Written by Dimitri Zabelin, Currency Analyst for DailyFX.com
To contact Dimitri, use the comments section below or @ZabelinDimitri Twitter


