
Trade Wars Talking Points:
- US President Trump tweeted that the ‘remaining’ $300 billion in Chinese imports will be taxed 10%
- The response from the market was violent with the S&P 500 suffering a 65 point intraday swing lower
- All risk-leaning assets are influenced by this development, but the systemic influence doesn’t stop there
See the history of trade wars over the past century in our interactive infographic. This is the first time economies have waged economic warfare.
Trade wars is one of the most prominent threats to the global financial markets – as much for the uncertainty of its course as for the economic toll it is taking. Historically, when the principal US-China economic standoff has intensified, the response has proven quite severe. This is particularly true the greater the level of premium that is built into key markets when the news is delivered.
Early Thursday afternoon in Washington DC, President Trump issued another update on the ongoing trade war when he tweeted that an additional $300 billion in Chinese imports (roughly the remainder of shipments from the country not already under tariff) would be taxed 10 percent. This is a painful upgrade in the ongoing engagement with potentially severe consequences for next steps across key markets. We take a look at some of the critical charts that you should watch as the market evaluates its exposure to this added burden.
S&P 500: The Benchmark of Risk Appetite

While the rise and fall of risk trends is a universal influence, there are a few assets that stand out far beyond the others as benchmarks of sentiment for fear and greed. Over the past 10 years, there is no more stretched archetype for ‘risk on’ than the S&P 500 and its fellow indices (Dow, Nasdaq). Having hit record highs this past month, an increasingly dramatic gap has opened between this particular segment of the market and the rest of the system. In other words, if this speculative idol were to fall; it could stand as a sea change in sentiment.
USDCNH: The Manipulated Front of the Trade War
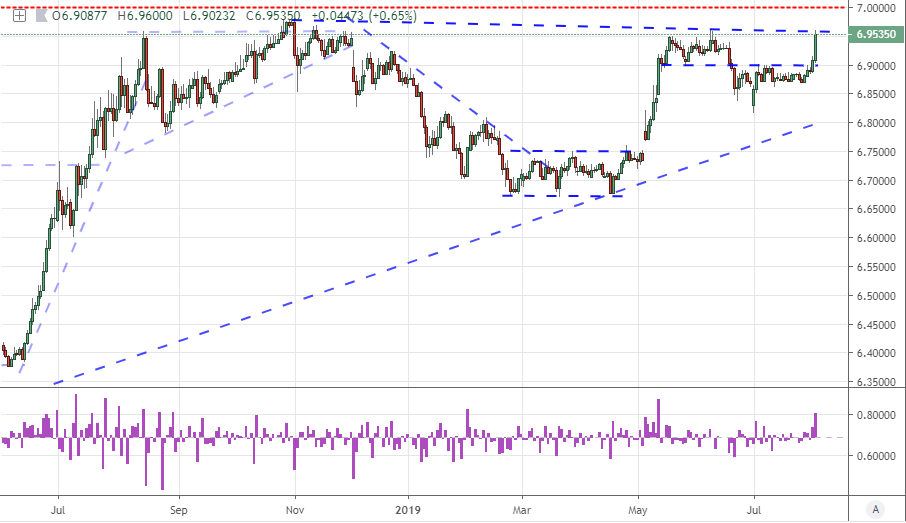
In evaluating the relative influence of the trade war and its economic impact between the two direct participants, what better measure is there than USDCNH. The news clearly hit hard as the US Dollar – Chinese Yuan exchange rate jumped to eventually overtake June’s swing high on an intraday basis. There is a caveat to the effectiveness of this pair as a measure however. Chinese authorities – mainly the People’s Bank of China (PBOC) actively curbs bullish pressure in the exchange rate to stem interpretations that there is a capital flight from China. That said, as the markets await China’s retaliation, questions about whether the Yuan can be used as part of the retaliation will persist.
AUDUSD: US-China Exposure Without the PBOC
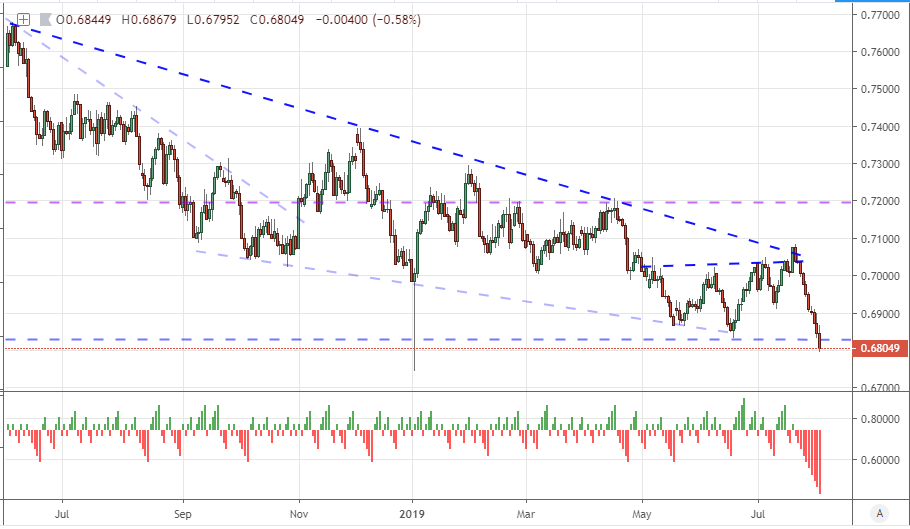
Australia took for granted its direct connection to China during the height of the Great Financial Crisis, as demand for its exports helped prevent the Aussie economy from sinking into a recession with much the rest of the world. Well, that link works both ways. As the trade war crimps Chinese exports – which account for the principal influence of its GDP – it slows the world’s second largest economy and dampens its appetite for raw materials from Australia. There is a strong correlation between USDCNH and AUDUSD, but the latter is missing one crucial element: the PBOC. There is no authority working to cap the depreciation of the Australian Dollar as there is the Yuan. AUDUSD has dropped a record 10th consecutive session through Thursday to levels (on a close basis) not seen in over a decade. This is as much a signal as its own instrument.
The Dollar: Not a Simple Safe Haven
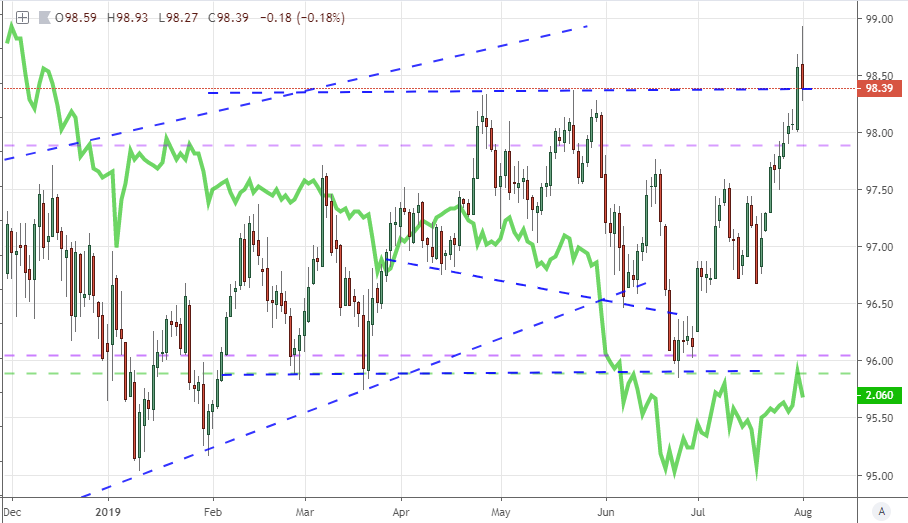
The US Dollar is historically viewed a baseline safe haven. In textbook terms, it should rise as uncertainty increases. Yet, what happens when the uncertainty originates from the US or if the country’s economy and assets are particularly exposed to the troubling winds that are blowing? That is the situation that we find the Greenback in now. While a full financial crisis and absolute need for liquidity would revive the currency’s safety appeal, anything short of that will become mired in the complications. One of those key complications we experienced earlier this week was the monetary policy situation. Chairman Powell (attempted to) make clear the group’s intention not to embark on a consistent policy easing regime. After today’s fireworks, the probability of a rate cut at the next meeting in September jumped to 72% via Fed Funds futures (above) and 90% through swaps.
Shanghai Composite and FXI: China’s Barometers
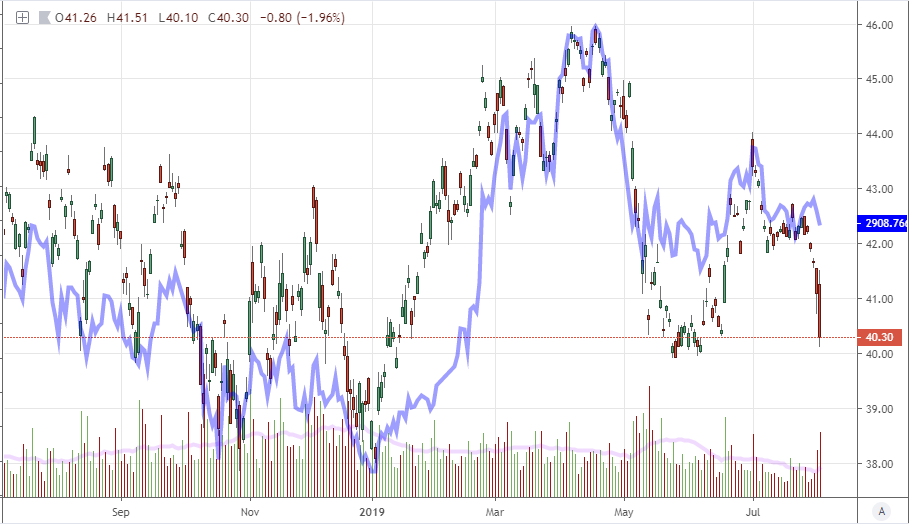
As with the Yuan, there is some difficult in gauging the impact that this international fracas is causing Chinese capital markets. The Shanghai Composite (blue above) is the benchmark index for the country and it has certainly seen its fair share of volatility. That said, there is almost certainly moderation being down on behalf of the local market to prevent any sense of panic that could arise from such headlines. Perhaps a better place to look would be the US-based FXI Index. This is a product meant to reflect China; and while it does theoretically look to offset against that control, the market’s impact comes through a little clearer.
EEM Emerging Markets: The ‘Little Guys’
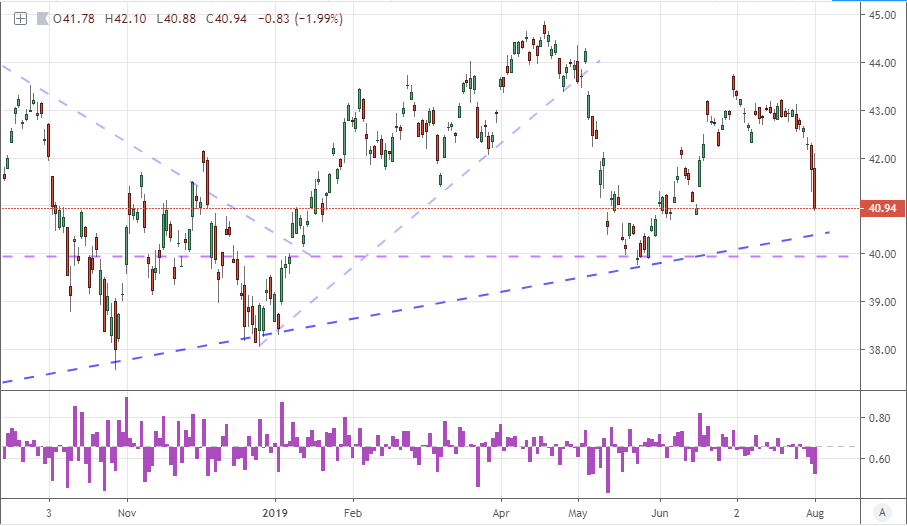
The United States and China are the world’s two largest economies. So while their direct engagement registers fairly severe impact during a trade war, they also have great capacity to absorb the pain. That is not necessarily true of the smaller, developing countries that depend on the consumption of these two giants for their livelihood. Emerging market economies are usually export heavy and thereby rely either on the demand for finished goods in the US or raw materials in manufacturing in China. While both countries suggest they can continue on without too much detriment amid the trade war, there is little doubting they will absorb significant economic impact resulting in slowed growth and tempered demand. The EEM is a good reflection of the section of the speculative market and it is already trading a deep discount to US equities. Keep an eye on how far it sinks.
Gold: A Haven Against Financial Instability and Devalued Fiat
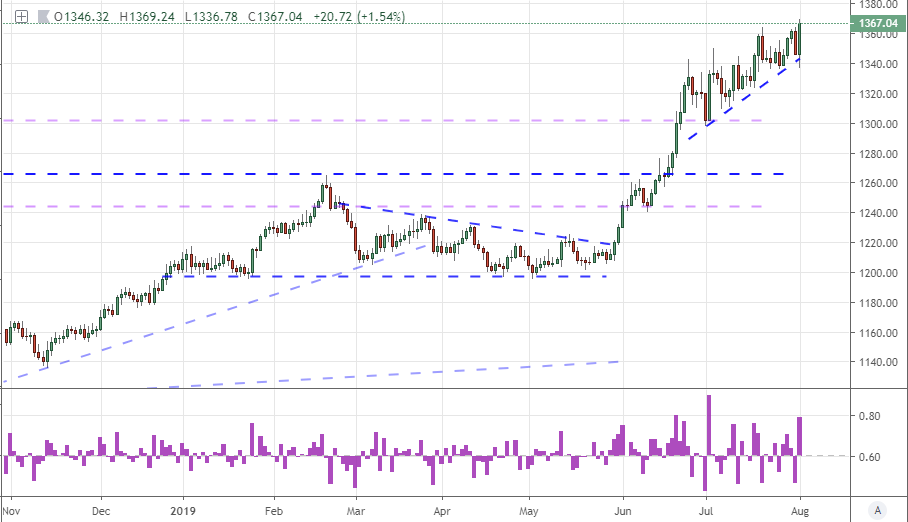
If Dollar, Yen and Franc are all diminished havens owing to their roles in the ongoing uncertainty around the world, where do we look for genuine safety? There is one safe haven that stands to perform particularly well as risk aversion finds exacerbation through a worry about the financial stability of the world’s largest players and the reliability of their fiat (currency and debt). We are seeing this is clearly the case given the drop in yields during the escalation of monetary policy accommodation. Above is Gold priced evenly in Dollar, Euro, Pound and Yen. It is the best alternative to traditional currency, so it is worth evaluating its climb outside of the simple reflection of the US Dollar.
If you want to download my Manic-Crisis calendar, you can find the updated file here.
See how retail traders are responding to the market volatility – whether they are positioning for ranges to hold and momentum reverse or whether they are committing to breaks – in benchmarks like the S&P 500, Gold, EURUSD and much more on the DailyFX Sentiment Page.