


Gold Price Outlook:
- XAUUSD is up 10.5% in the year-to-date as upcoming Fed rate cuts look to stoke inflation
- Similarly, investors have expressed growing concern of the US economy and stock market which could be partially responsible for increased gold holdings
- Conversely, the high-yielding HYG and JNK ETFs have recorded net inflows for the year, signaling that not all investors share the same concerns
Gold Price Gains Kept Afloat by Robust ETF Holdings and Demand
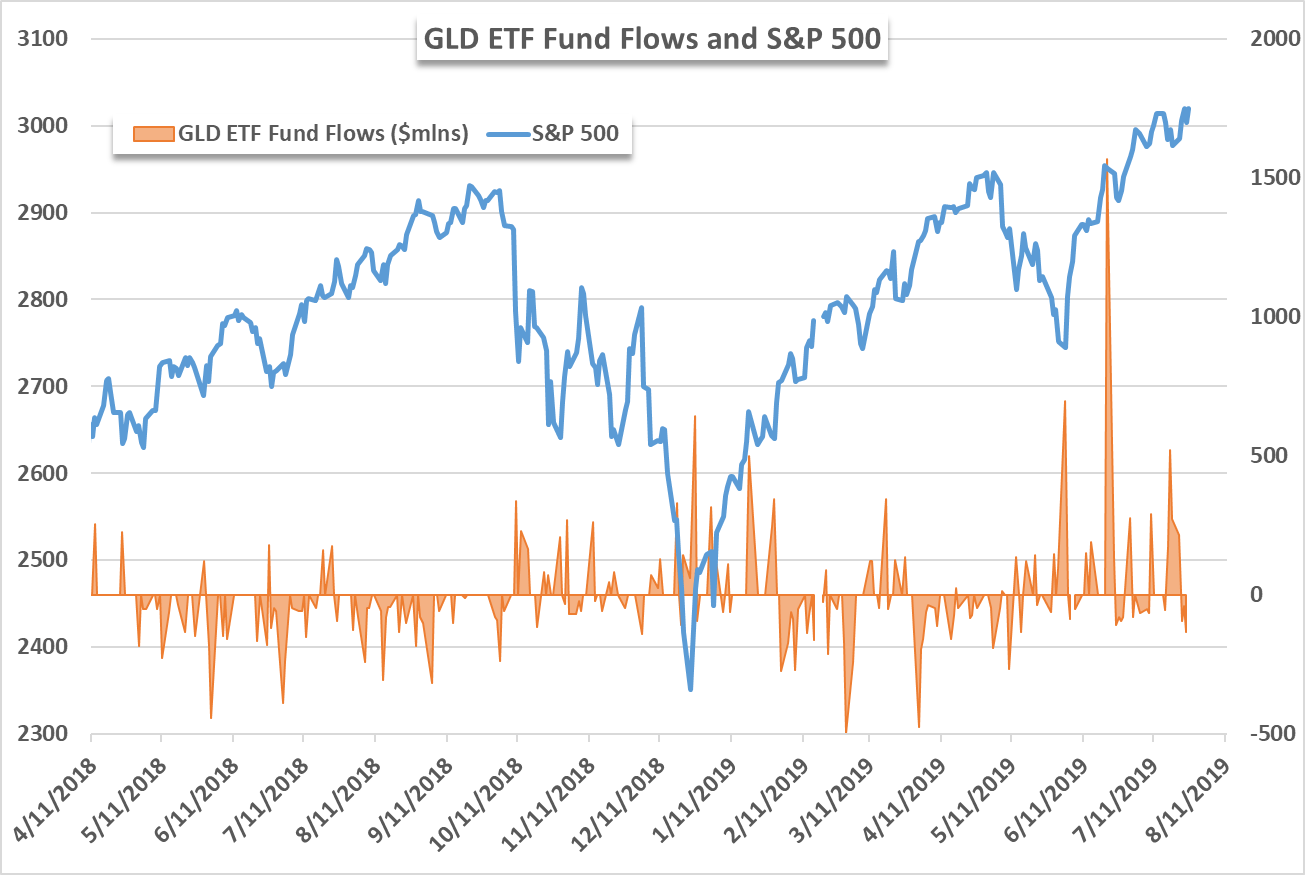
Gold has climbed 10.5% in the year-to-date after its spot price surged in June. Since then, gains have been meager but continued demand reflected in ETF fund flow data suggests investors are still optimistic the precious metal will continue its journey higher. Since its June rally, the gold-tracking GLD ETF has registered 3.4 billion in net inflows.
Source: Bloomberg
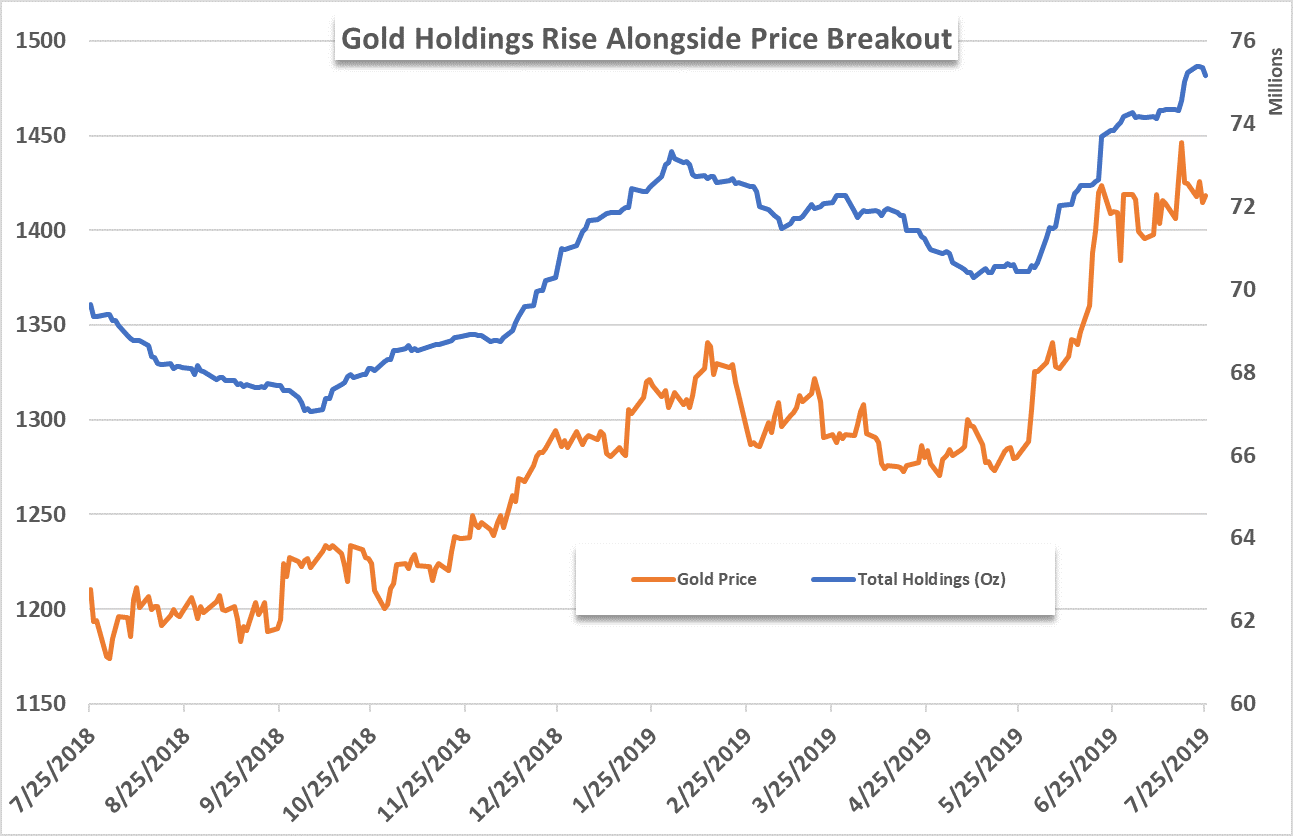
Gold’s price spike in June saw investors clamor for exposure to the yellow metal as they aimed, or perhaps hoped, to latch onto an extension of the breakout. This resulted in GLD’s largest intraday inflow ever on June 21, with nearly $1.6 billion entering the fund. The recent demand has pushed the total to almost $1.6 billion in net inflows for the year-to-date. It is worth noting this data does not include flows to the gold “mini” ETF, GLDM. That said, total ETF holdings of gold remain near their 2019 high of 75 million ounces according to data from Bloomberg. Follow @PeterHanksFX on Twitter for updates and analysis on fund flows and the ETF space.
Source: Bloomberg
Gold’s price climb has been fanned by the likelihood that the Federal Reserve will cut the Federal Funds rate at its July FOMC meeting next week. A potentially lower Fed Funds rate has stoked inflation expectations – allowing gold to enjoy some demand as a hedge against inflation.
Interested in longer-term trades? Check out our Third Quarter Forecast s for Gold, EURUSD and more.
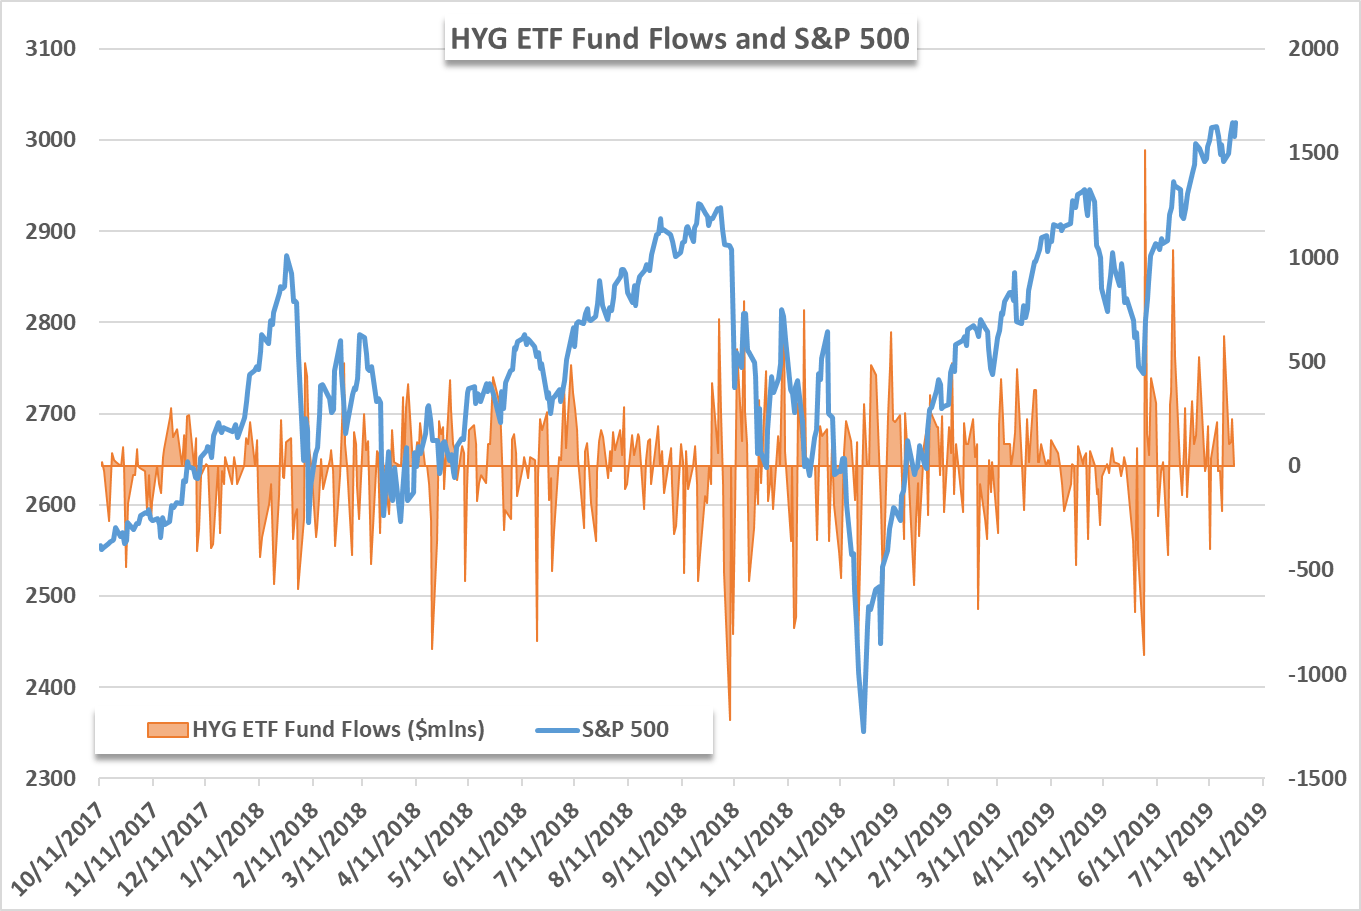
Elevated concern regarding the health of the US economy and the stock market could also give rise to safe haven demand, another key characteristic of the precious metal. While concern in some areas of the economy is merited, not all investors are convinced as some continue to pile funds into the high-risk, high-reward HYG and JNK ETFs.
Source: Bloomberg
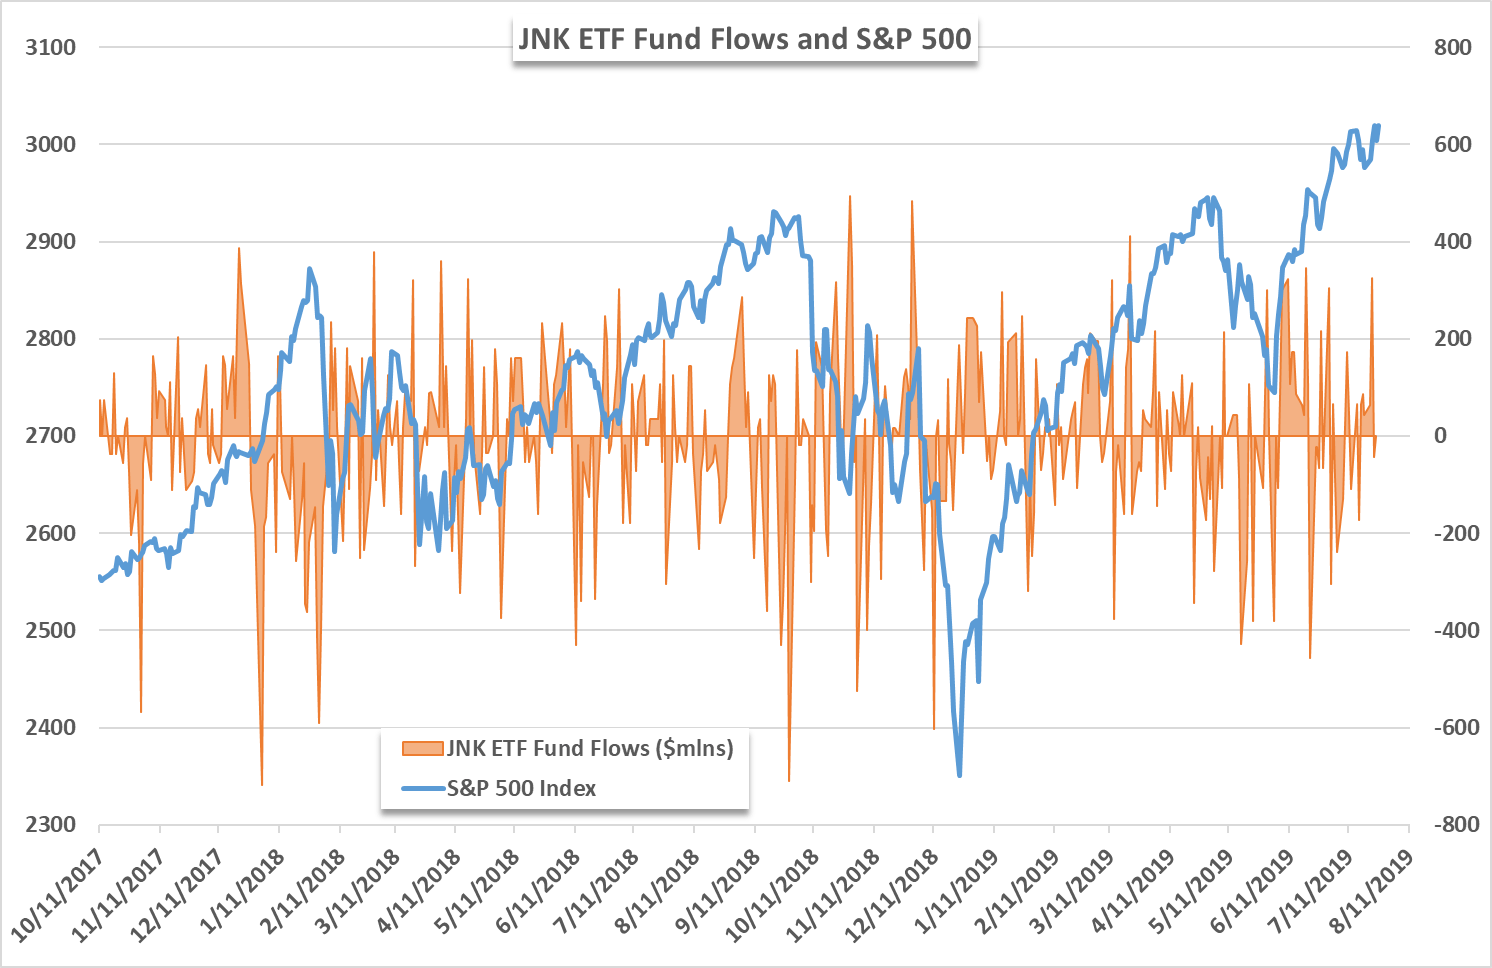
The HYG ETF offers exposure to high-yield corporate debt which is expectedly risky. With the potential for looser monetary policy, the fund flows suggest investors are betting cheaper credit will allow the underlying distressed companies to remain afloat while investors grasp for yield in a lower-for-longer interest rate environment. The aptly named JNK ETF, because it offers exposure to largely junk bonds, has seen a similar trend in recent weeks but with more frequent outflows.
Source: Bloomberg
Despite noteworthy outflows, JNK has seen a net inflow of $1.7 billion in the year-to-date. The demand for both gold and high-yield debt illustrates the divergent nature which the market is currently experiencing. Concern regarding the lofty valuation of the S&P 500 is widespread, but many are unwilling to miss out on a continuation rally. Still, it could be argued the build up in gold holdings is indicative of larger themes at play – beyond mere price action.
Gold Price Chart (XAUUSD): Daily Time Frame (August 2018 – July 2019)
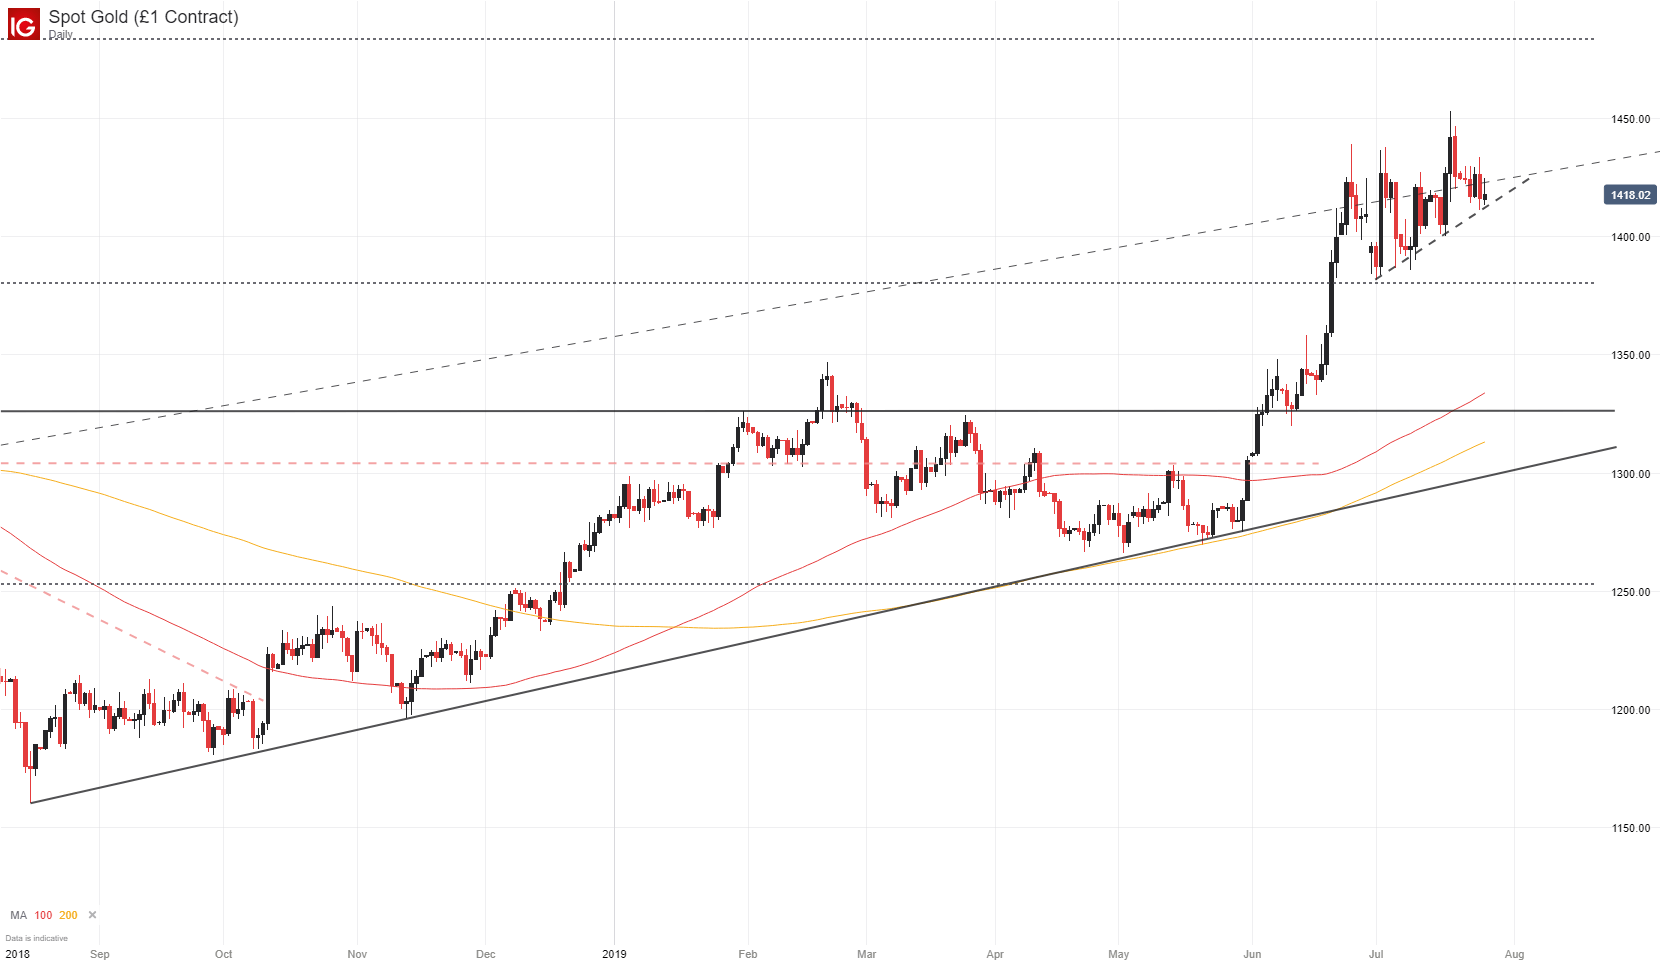
That said, next week’s FOMC meeting could play a critical role in the outlook for gold’s price through the latter half of 2019. While the outlook appears tilted to the topside at present, a pivot in monetary policy could quickly shift the economic landscape. While such a pivot is unlikely, market participants should be cognizant of all possibilities. In the interim, traders can look to gold technicals for shorter-term guidance.
--Written by Peter Hanks, Junior Analyst for DailyFX.com
Contact and follow Peter on Twitter @PeterHanksFX
Read more: AMZN, GOOG Earnings to Drive Nasdaq 100 Price, Tech Stocks


