


The second quarter saw global equity markets negotiate a flurry of conflicting fundamental themes with trade wars and monetary policy at the forefront. Although the ongoing US-China trade war weighed on global growth and sentiment, a remarkable shift from the Federal Reserve allowed most of the major indices to post a narrow gain for the quarter.
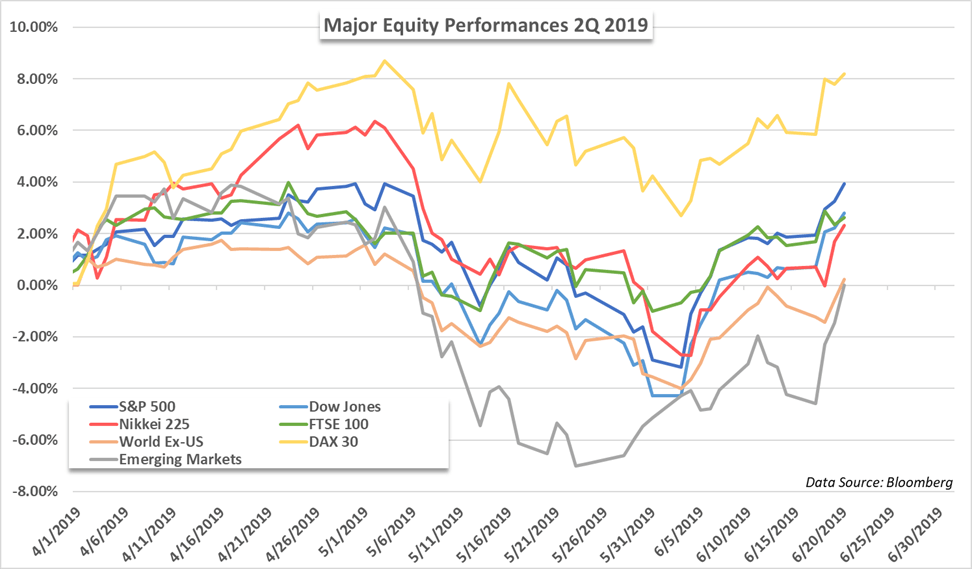
Chart prepared by Peter Hanks
Technical Analysis: Trend is Up, but Big-picture Price Swings Highlight Growing Uncertainty
The first half of the year is in the books and it was a positive segment, however; that doesn’t mean longer-term the stock market is in great shape. The last few months of strength went on to create a higher-high from September after posting a big lower-low in December (relative to early 2018).
The chart below highlights these higher-highs and lower-lows, a sequence called a Reverse Symmetrical Triangle (RST). These patterns indicate growing uncertainty as price swings increase. Whether or not the pattern is about to turn bearish or not will take some time given the path of least resistance is still clearly higher in the short to intermediate-term.
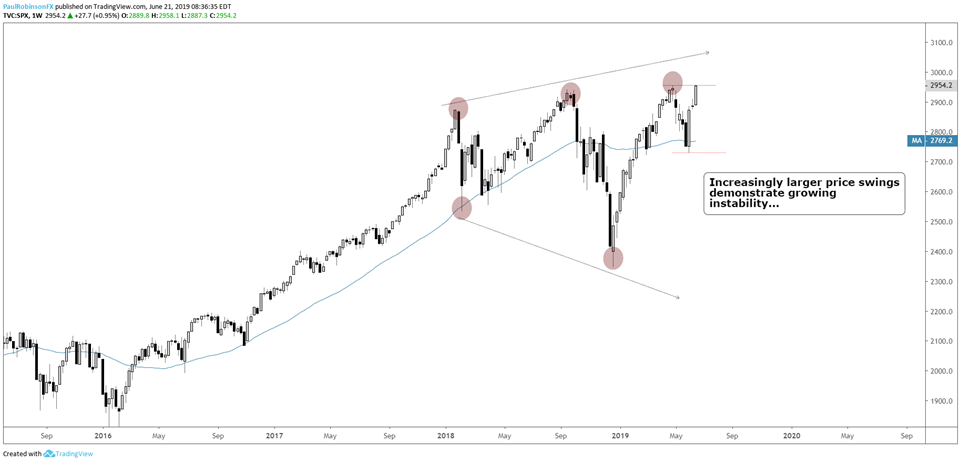
Chart prepared by Paul Robinson
To read the full Equity Forecast, download the free guide from the DailyFX Trading Guides page


