


USD, FED, CURRENCY VOLATILITY – TALKING POINTS
- USD implied volatility jumps ahead of the June Fed meeting announcement but appears relatively low
- The Federal Reserve is slated to release its updated view on monetary policy Wednesday at 18:00 GMT
- Currency traders will likely focus on revised economic outlook and rate guidance
- Join Chief Currency Strategist John Kicklighter for live webinar coverage of the FOMC rate decision
Uncertainty surrounding the future direction of Fed monetary policy has sent US Dollar price action soaring over the last month. The move was largely sparked by a breakdown in negotiations between the US and China at the beginning of May. Since then, sizable setbacks to global GDP growth expectations and a major selloff in risk assets like stocks, oil and emerging market currencies have been met with markets placing hefty reliance on central banks to loosen financial conditions and keep the global economy on track. Investor sentiment and appetite for risk has since recovered, however, primarily driven by mounting Fed rate cut bets which have amassed to roughly 75 basis points of easing by year end according to overnight swaps.
US DOLLAR INDEX (DXY) OVERNIGHT IMPLIED VOLATILITY – CHART 1: DAILY TIME FRAME (JUNE 18, 2018 TO JUNE 18, 2019)
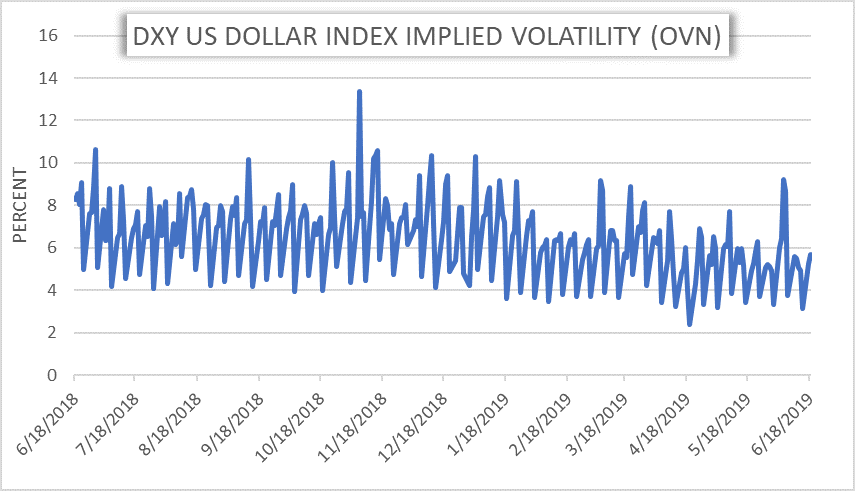
Now, immense pressure has been placed on the Federal Reserve and Chair Powell to match the lofty rate cut expectations during Wednesday’s FOMC rate announcement and follow-up press conference. While rate traders are only pricing in a 23 percent probability that the Fed cuts its policy interest rate today, focus will be placed primarily on the Fed’s updated summary of economic projections which details the central bank’s forecasts for US GDP, employment, inflation and the federal funds rate.
The ‘patient’ and ‘data-dependent’ monetary policy stance communicated by the Fed back in January could be echoed by Powell. Although, due to rising global risks and uncertainty, a slightly more dovish tone - likely to the tune of taking the 1 projected rate hike this year off the table and possibly capitulating to offer up 1 rate cut - should come as no surprise. That being said, US Dollar implied volatility looks seemingly low considering the current market environment and threatens to turn higher depending on how Wednesday’s Fed decision unfolds.
US DOLLAR INDEX (DXY) AND CURRENCY VOLATILITY INDEX (FXVIX) – CHART 2: DAILY TIME FRAME (AUGUST 23, 2018 TO JUNE 18, 2019)
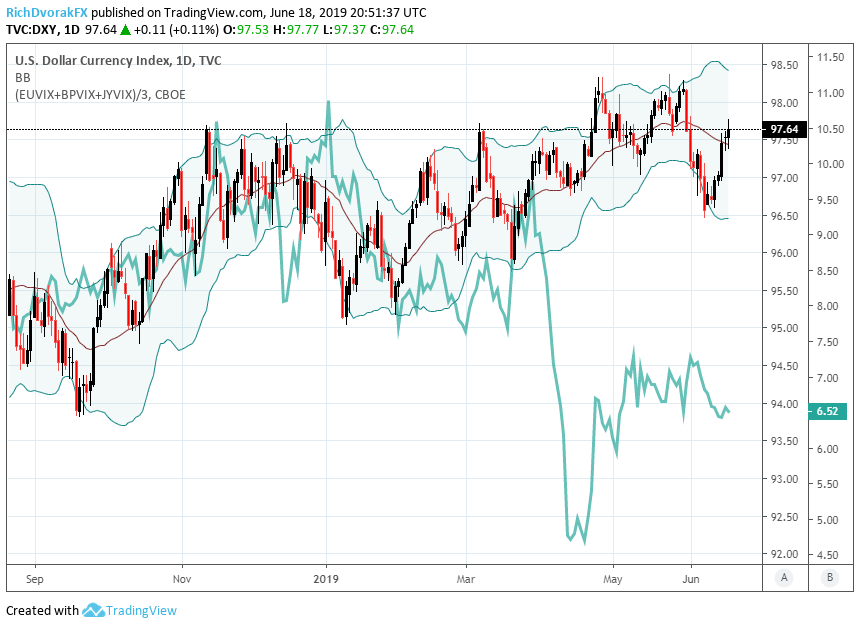
A sharp move in the greenback today in response to the June Fed meeting will likely send a shockwave across the forex market. Regardless if USD moves higher or lower in response to the FOMC and Powell, the market’s reaction threatens to propel currency volatility higher. This could result in a convergence between the DXY US Dollar Index and FXVIX – an equally weighed index of the Cboe 30-day implied volatility readings for the Euro, Pound Sterling, and Japanese Yen. Similarly, volatility in US treasuries and the S&P 500 Index risks turning higher.
S&P 500 VOLATILITY INDEX (VIX) AND US10YR TREASURY VOLATILITY INDEX (TYVIX) – CHART 3: DAILY TIME FRAME (AUGUST 29, 2018 TO JUNE 18, 2019)
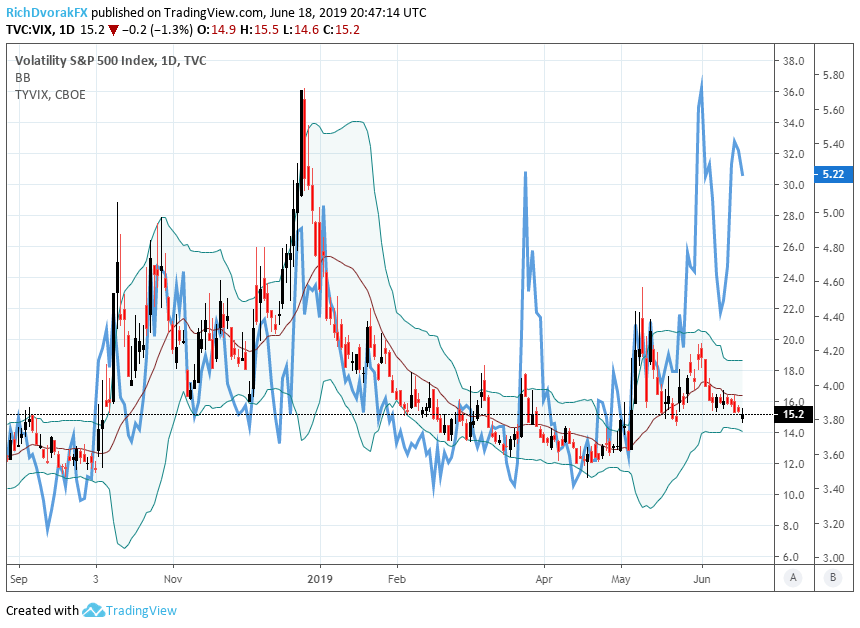
Overlooking the small blip in the last NFP report, the US jobs market remains on solid footing with tame inflation, healthy wage gains, and robust consumer spending. In other words, aside from exuberant complacency from easy-money hungry investors, there has been little realized economic evidence that supports the Fed rate cut narrative; let alone to the magnitude of 3 cuts currently priced by markets. Fear of 'what may come' of the US-China trade war has widely driven the entire Fed rate cut bias. As such, considering the risk that Powell and the FOMC fails to please investors with its June monetary policy update, the scenario of cross-asset volatility spiking higher seems probable.
US DOLLAR INDEX (DXY) AND RATIO OF US10YR TREASURY VOLATILITY INDEX (TYVIX) TO S&P 500 VOLATILITY INDEX (VIX) – CHART 4: WEEKLY TIME FRAME (MAY 16, 2016 TO JUNE 18, 2019)
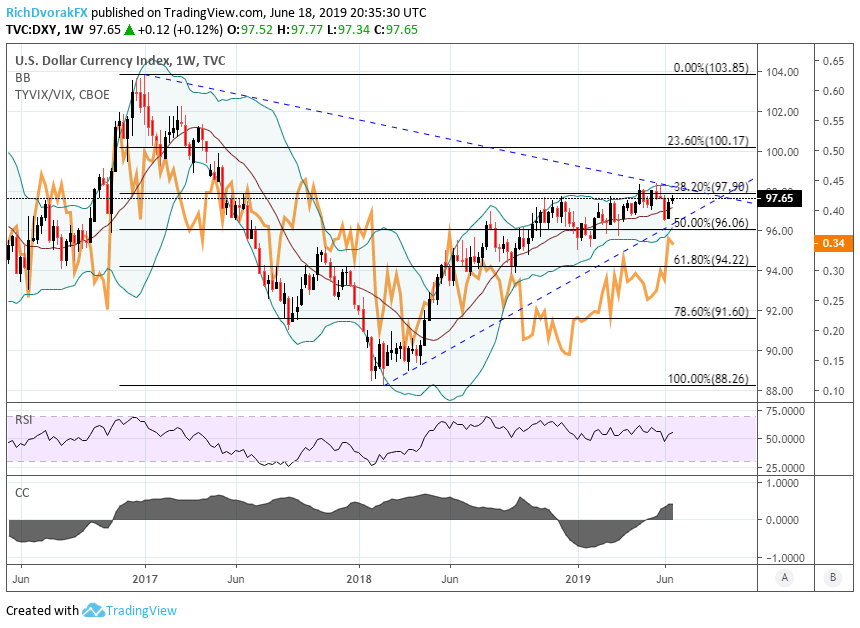
Since printing a multi-year high of 98.37, the DXY US Dollar Index has slid noticeably on the back of mounting Fed rate cut bets. The DXY has wedged itself between rising and falling trendlines following a string of lower highs and higher lows, appearing to form a triangle pattern that looks on the cusp of breaking out. Watching the ratio of the US10YR Treasury Volatility Index (TYVIX) to the stock market’s well known “fear-gauge” – or VIX – could serve beneficial to identifying the dollar’s next direction. A stark change to the closely watched Fed dot plot, in addition to the central bank’s forecasts for US GDP growth and unemployment, could serve as the catalysts that send markets swinging. Check out this article by DailyFX Currency Strategist James Stanley on US Dollar Price Outlook in EUR/USD, USD/CAD, AUD/USD and USD/JPY for additional USD insight and key technical levels to watch around the June Fed meeting.
- Written by Rich Dvorak, Junior Analyst for DailyFX
- Follow @RichDvorakFX on Twitter


