


NORDIC FX, NOK, SEK WEEKLY OUTLOOK
- USD/SEK may find new support at 9.5323
- USD/NOK approaching resistance range
- Bearish outlook for NOK, SEK remains
See our free guide to learn how to use economic news in your trading strategy !
SEK TECHNICAL ANALYSIS
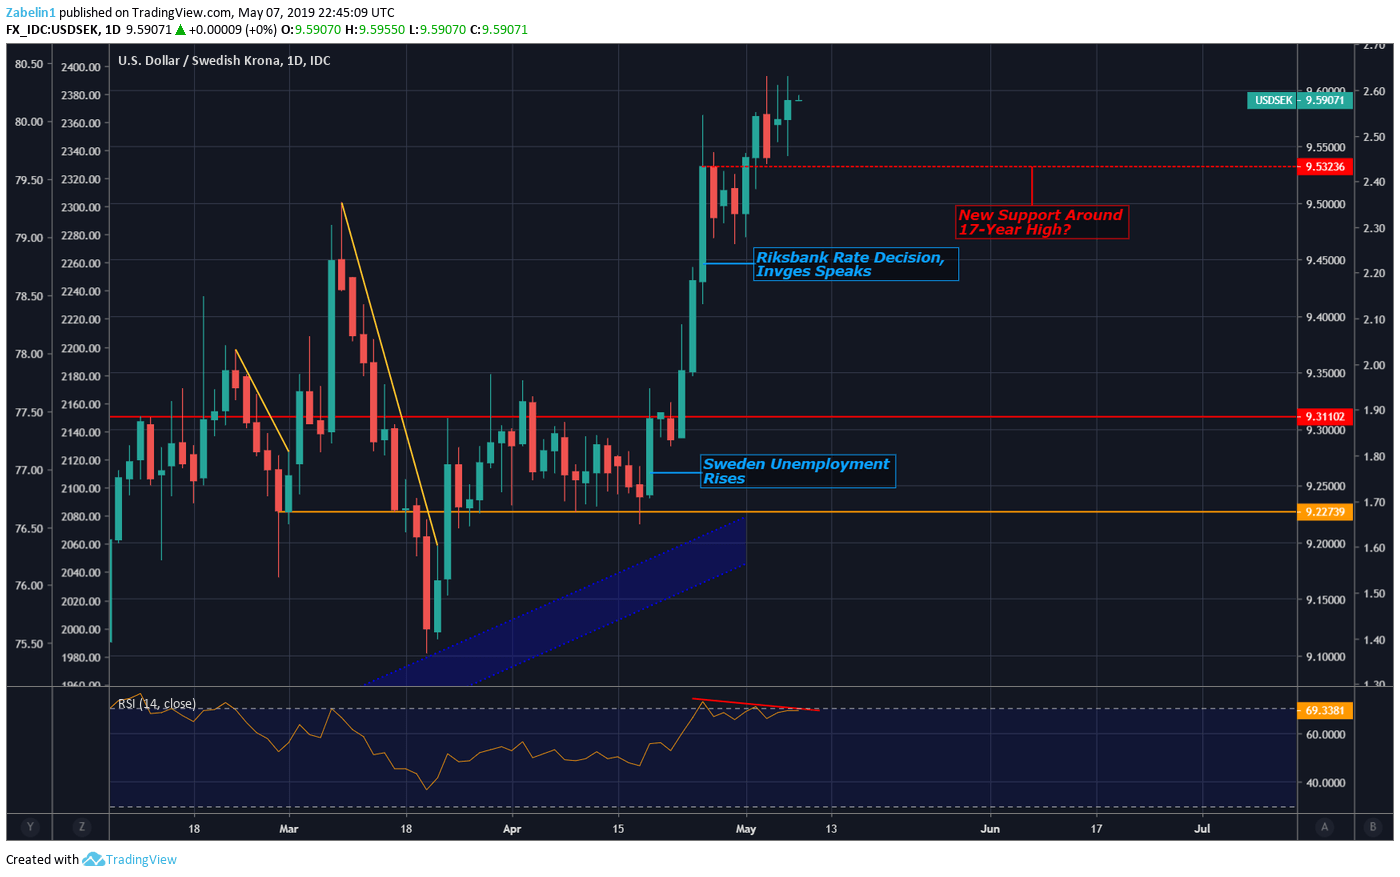
After peaking above 17-year highs, USD/SEK’s sugar rush may soon cool and result in a sugar crash with an eye at a possible new support at 9.5323. Negative RSI divergence is signaling underlying momentum is waning after the pair surged almost three percent in three days in April. The biggest jump was caused by the Riksbank rate decision and dovish commentary from central bank Governor Stephen Ingves.
USD/SEK – Daily Chart
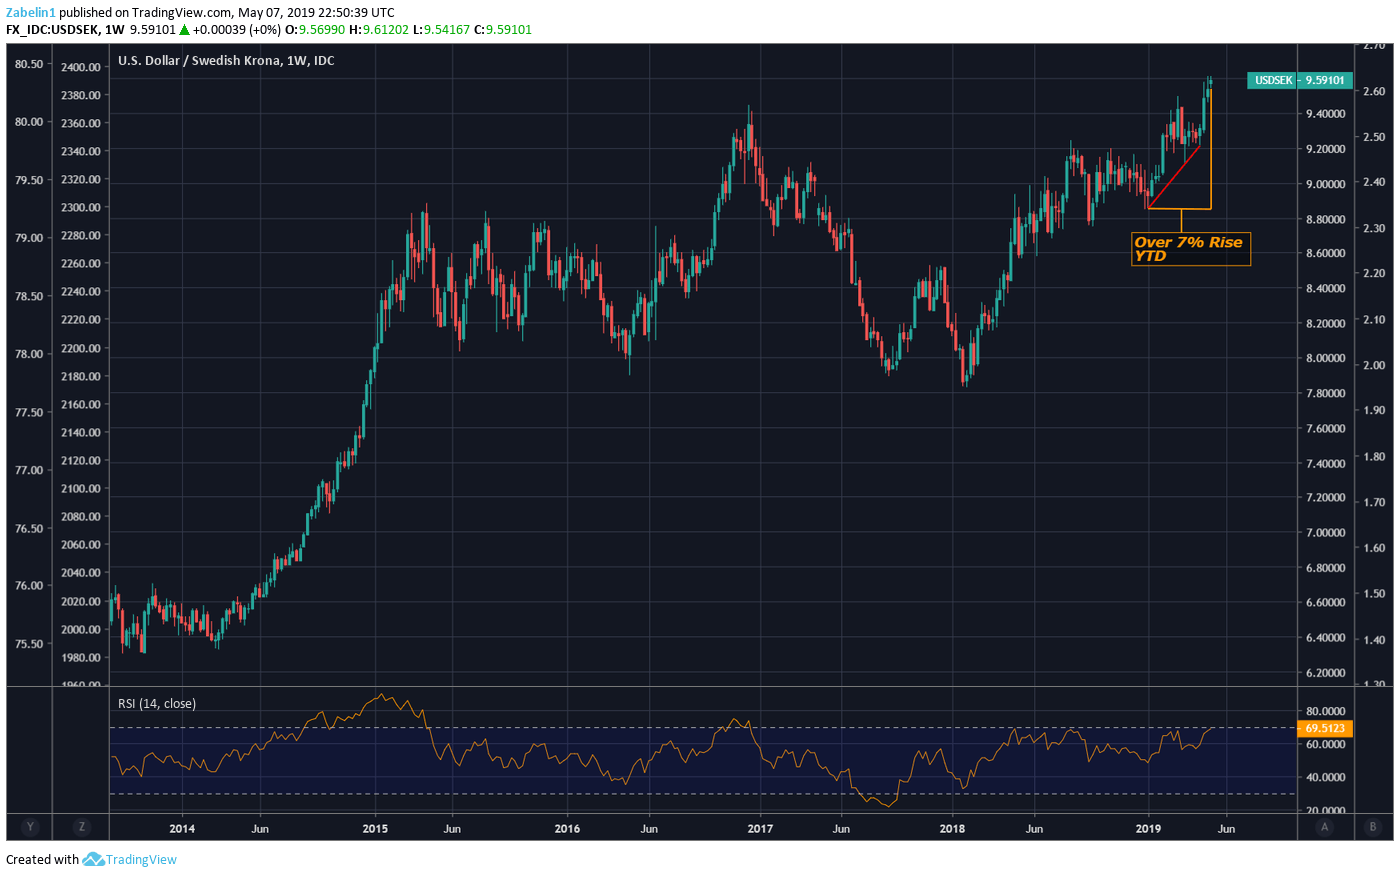
Zooming out to a weekly chart, year-to-date USD/SEK has increased over seven percent, with a total of over 20 percent starting in January in 2018. A week-by-week view shows underlying momentum remains strong with a fundamental backdrop that is supportive of a broad upward trajectory for the pair at least until year end.
USD/SEK – Weekly Chart
A monthly chart shows two possible support levels USD/SEK may test if a major reversal occurs. Right now, the pair is hovering on the cusp of 9.4907 (red line). If the pair cannot continue to trade above this level, the next possible floor lies at 9.2981 (orange line), with what will likely be another strong psychological support at 9.2275 (blue line).
USD/SEK – Monthly Chart
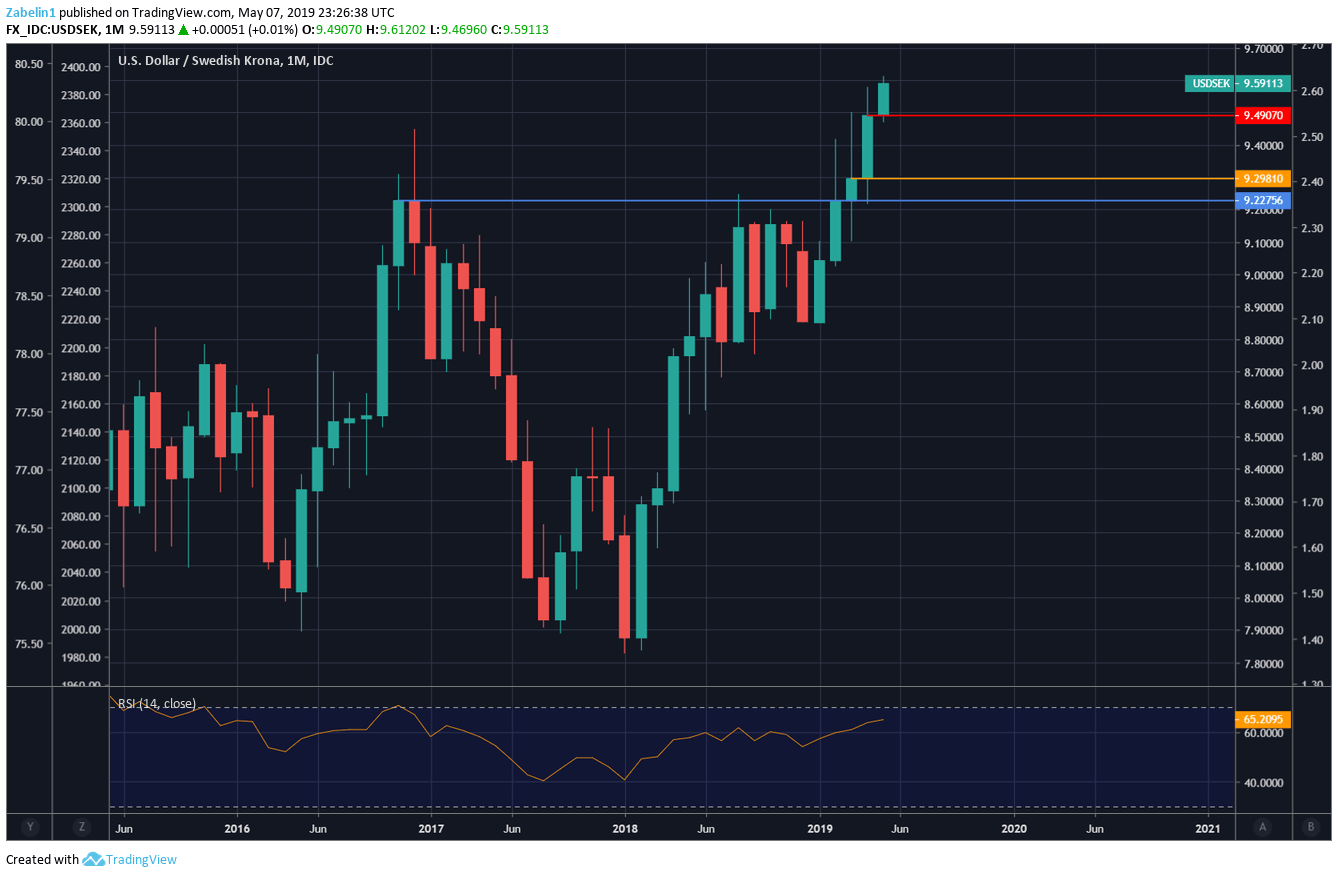
The latter price level was tested as resistance in the last breaths of 2016 with the most recent attempt just this past February. The break above of it in February and subsequent follow-through in March and April reinforced a bullish outlook for USD/SEK.
NOK TECHNICAL ANALYSIS
After rebounding from the upper lip of the upward-sloping support channel (red range), USD/NOK is on track to test a resistance range between 8.74-8.75 (blue channel). The last time the pair traded within this range was back in December 2018.
USD/NOK – Daily Chart
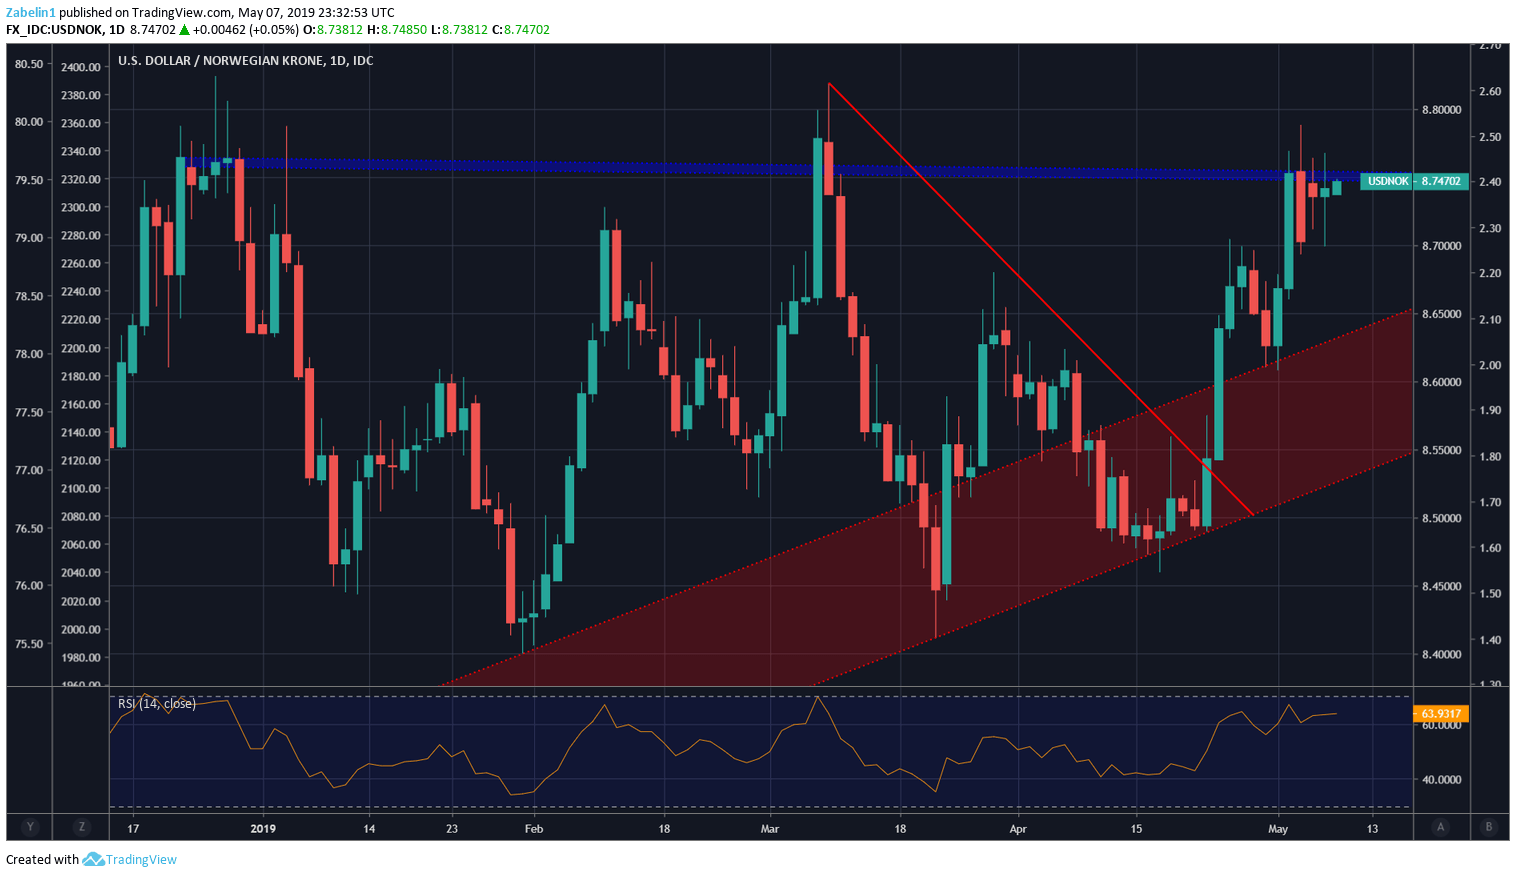
USD/NOK has been trading on the edge of the lower bound of resistance, with long wicks and small bodies implying indecision. Given the broad upward trajectory along the steep support channel, it is not likely that this resistance will hold for long. The fundamental backdrop for USD/NOK is supportive of continued upward momentum.
USD/NOK – Daily Chart

Whether the pair will break above resistance this week in large part has to do with the upcoming Norges Bank Rate decision. If officials express unexpectedly dovish undertones, it could cause the pair to spike above this level.
However, if they are more hawkish than expected or are less dovish than what market participants are anticipating, it could cause the pair to have a sharp dip. However, it would not likely cause enough of a shift to overhaul the broad uptrend the pair has had since March 2018.
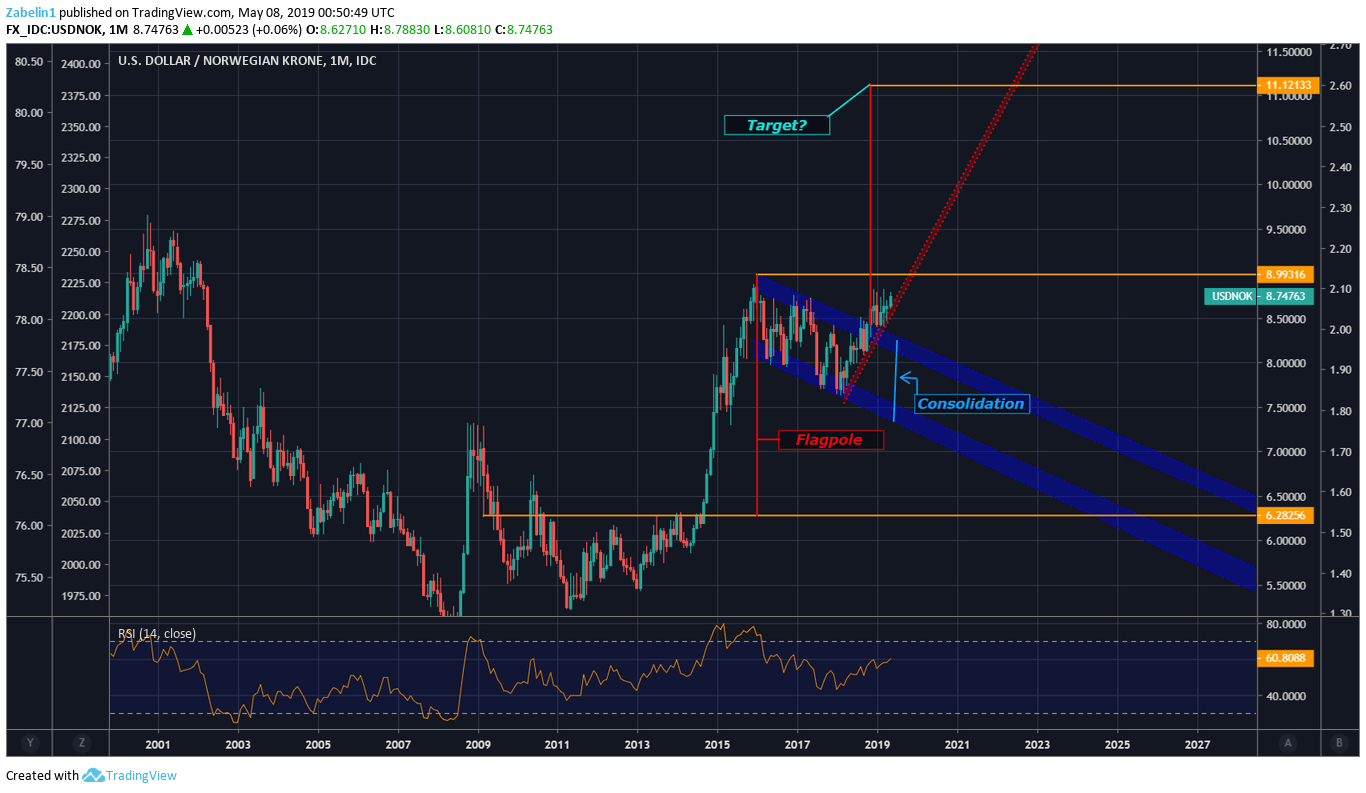
Taking a monthly chart into perspective shows that the pair appears to be forming a bullish Flag setup, a continuation pattern that involves a brief period consolidation prior to resuming its previous trajectory. After being stuck in a two-year downward-facing trading range (blue parallel channels), the pair broke out in November 2018 and has continued to trade higher.
The next major resistance appears to be at 8.9931 (yellow line). Beyond that, the target point could be at 11.1213. If USD/NOK continues to trade higher with this target in mind, it is uncertain whether the pair will be able to climb along the steep and upward-sloping 2018 March support channel. Nearer term, the pair will likely be able to breach 8.9931 by year-end.
USD/NOK – Monthly Chart
SWEDISH KRONA, NORWEGIAN KRONE TRADING RESOURCES
- Join a free Q&A webinar and have your trading questions answered
- Just getting started? See our beginners’ guide for FX traders
- Having trouble with your strategy? Here’s the #1 mistake that traders make
--- Written by Dimitri Zabelin, Jr Currency Analyst for DailyFX.com
To contact Dimitri, use the comments section below or @ZabelinDimitri on Twitter


