


Stock Market Fund Flows Talking Points:
- Broad-market ETFs SPY, IVV and VOO notched $6.4 billion in outflows in an eventful week for US monetary policy
- The flows suggest bullish sentiment even as US indices look to end Friday notably lower
- Interested in equities and ETF fund flows? Sign up for the weekly webinar - Stock Market Catalysts for the Week Ahead
Stock Market Fund Flows Suggest S&P 500 Sentiment Remains Bullish
The S&P 500 is headed for a painful Friday close, retracing the bullish reaction to Wednesday’s dovish FOMC meeting. At the time of this article’s publication, the index traded narrowly above 2,800 and slightly below prior resistance at 2,815, but considerable inflows into some of the market’s largest exchange traded funds suggest investors are still confident in the index’s ability to run.
Aggregate Fund Flows for Broad Market ETFs versus S&P 500 (Chart 1)
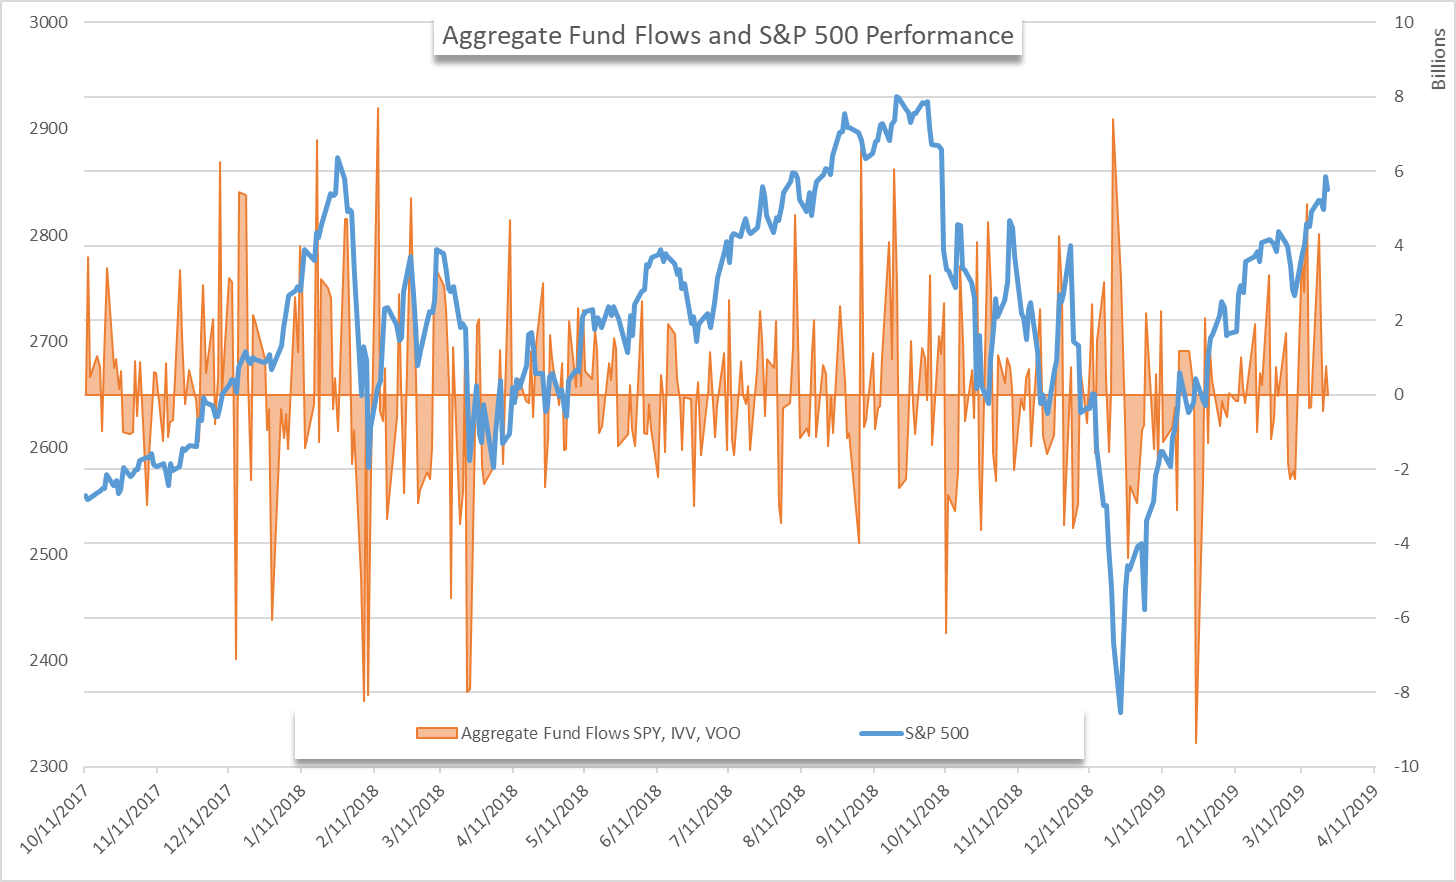
The aggregate fund flows of SPY, IVV and VOO totaled $6.4 billion this week, with an intraday inflow of $4.3 billion on Monday alone. Investors were similarly confident on Tuesday, adding $1.8 billion in exposure to the three funds. After minor outflows on Wednesday, bullishness returned Thursday with an inflow of $782 million.
Compare how ETF investors are positioned to IG Clients using IG Client Sentiment Data.
For the year to date, net aggregate fund flows total $113 million, displaying investor indecision despite a corresponding 12% gain in the S&P 500. Profit-taking could partially explain the virtually deadlocked fund flows for the year, while capital rotation into more-specific sectors may explain it further.
HYG ETF Fund Flows versus S&P 500 (Chart 2)
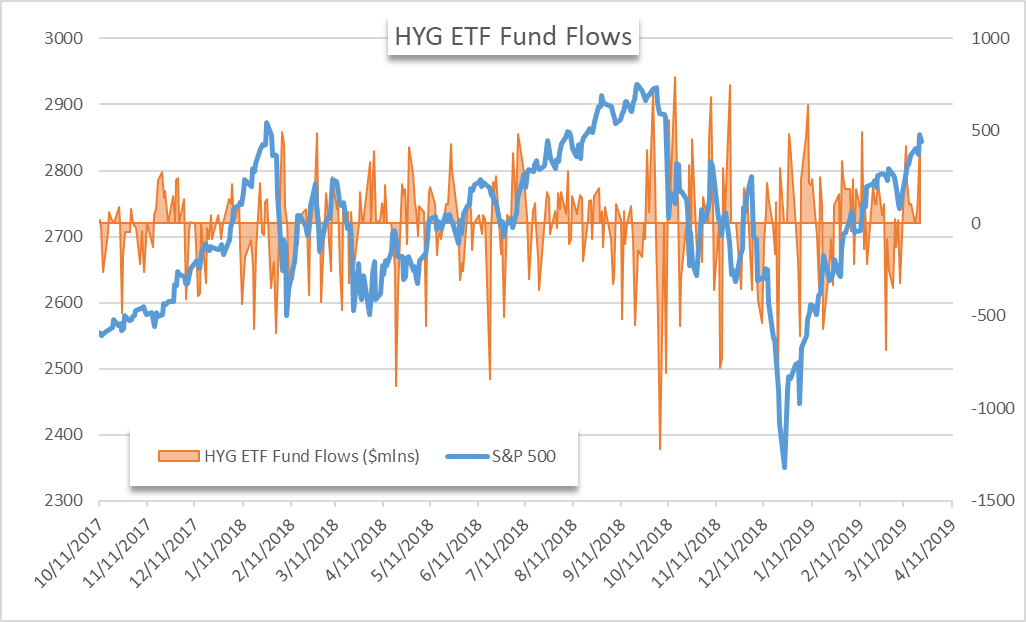
The high-yield corporate debt ETF – HYG - posted a string of inflows this week. In total, $687 million in fresh capital entered the fund, a sign investors were confident the S&P 500 was aimed higher. Consequently, the ETF has seen over $2 billion in fresh capital for its coffers in the year to date. As general market theory would suggest, T-Bills have seen relatively consistent outflows.
BIL ETF Fund Flows versus S&P 500 (Chart 3)

The BIL ETF which grants exposure to 1-3-month T-Bills managed a weekly net inflow of $64 million, even as the dovish policy from the Federal Reserve weighs on yields. In the year to date, the fund has seen $765 million exit the fund, contrasting the consistent demand for more high-yielding debt like HYG. Still, BIL may be one important fund to watch in times of equity turbulence. If the broader equity markets were to fall under pressure, the relatively safe ETF would benefit and see greater demand.
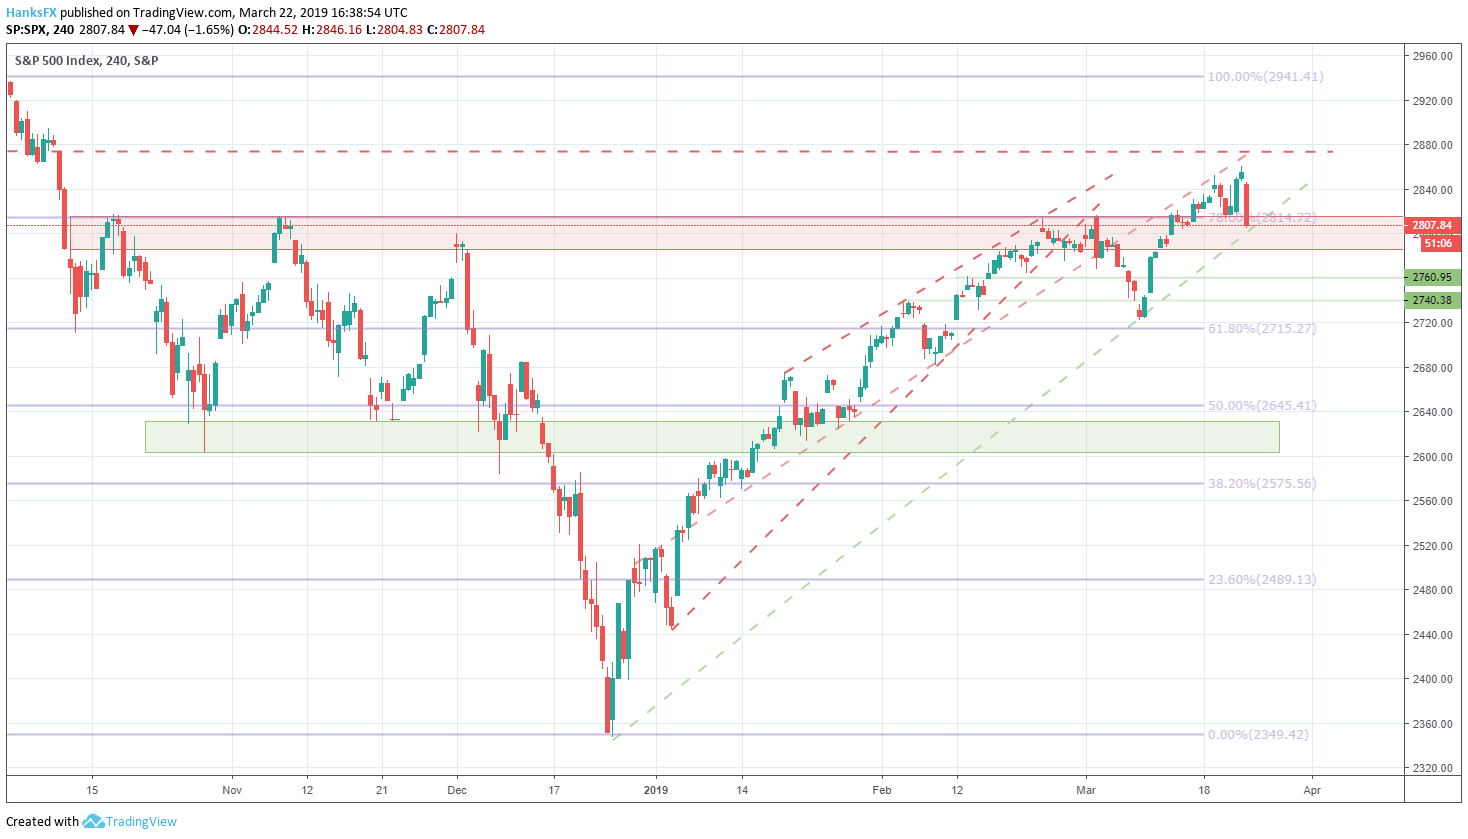
S&P 500 Price Chart: 4 – Hour Time Frame (October 2018 – March 2019) (Chart 4)
Learn tips and tricks to day trading the S&P 500
As for the immediate outlook, the S&P 500 has multiple technical levels to negotiate. The index now trades within the band that previously offered resistance from 2,786 to 2,815, bolstered by the 78.6% Fibonacci level at 2,814. Beyond that, a tentative support trendline from December lies slightly below. Follow @PeterHanksFX on Twitter for deeper stock market and equity insights.
That said, the trendline has not been solidified as it only has two points of contact. If the trend is to gain technical respect, a close above the line early next week is paramount. With the S&P 500 trending higher since late December, a decidedly dovish Fed and consistent ETF inflows, the index has a plethora of reasons to trade higher next week.
View our Economic Calendar for important events and data releases next week.
On the other hand, domestic and global growth remain headwinds. Next Thursday will offer meaningful insight on the US economy with the release of first quarter GDP. For trend continuation purposes, the data will need to impress. ETF flows leading up to the data’s release next week may shed light on investor sentiment regarding the release.
Read more: Will the Stock Market Crash in 2019?
--Written by Peter Hanks, Junior Analyst for DailyFX.com
Contact and follow Peter on Twitter @PeterHanksFX
DailyFX forecasts on a variety of currencies such as the US Dollar or the Euro are available from the DailyFX Trading Guides page. If you’re looking to improve your trading approach, check out Traits of Successful Traders. And if you’re looking for an introductory primer to the Forex market, check out our New to FX Guide.


