


NOK, SEK TALKING POINTS – WEEKLY TECHNICAL FORECAST
- USD/SEK re-entered 9.3110-9.4066 range
- Is USD/NOK flirting with 8.6323 support?
- Brexit vote volatility makes outlook foggy
See our free guide to learn how to use economic news in your trading strategy !
USD/SEK TECHNICAL ANALYSIS
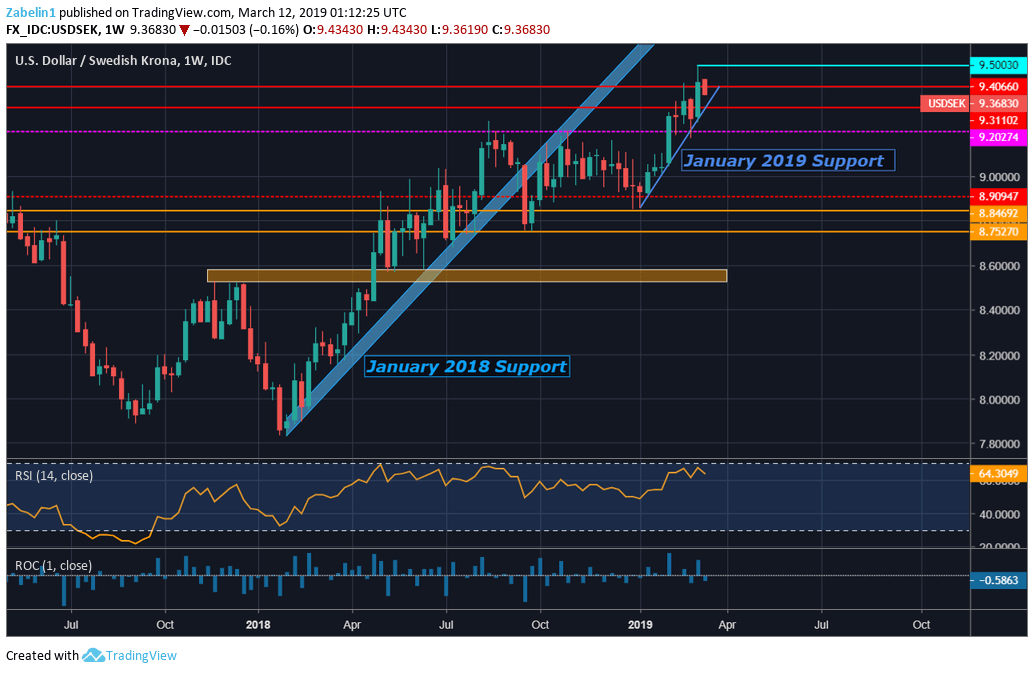
After closing above a 17-year high at 9.4494 with the fingertips at 9.5003, USD/SEK subsequently had some pullback and re-entered a trading range between 9.3110-9.4066. The frequently-tested rising January support line might provide an ample foundation for the pair to continue its climb should prices fall in the interim. In such an outcome, the pair may struggle to continue along the steep incline as the upper lip of the resistance range holds once again.
USD/SEK – Daily Chart

Zooming out to a weekly chart, the pair appears to be resuming what looks like a broad uptrend starting in January 2018. Between August 2018 and January 2019, the pair traded sideways in a range of 8.9094-9.2027 before it resumed its steep incline.
USD/SEK Weekly Chart
USD/NOK TECHNICAL ANALYSIS
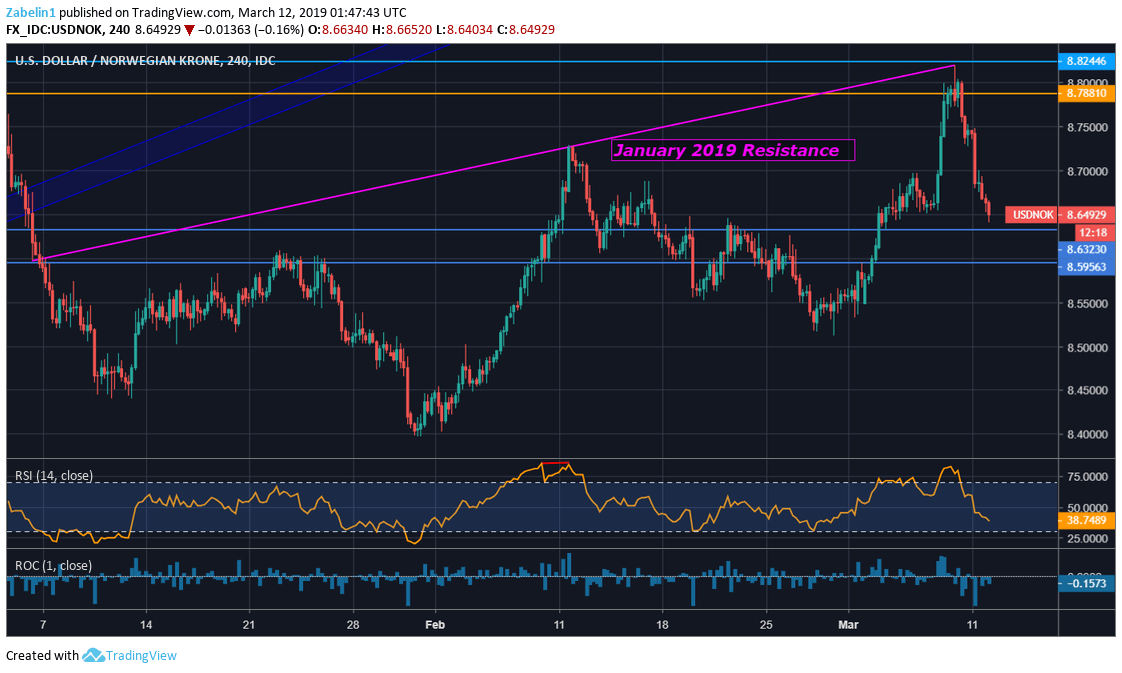
USD/NOK also had a meteoric rise with the height at 8.8197 and a close at 8.7995, the highest since December 2018. Around that same time, a resistance range appeared to have been formed between 8.7881-8.8244. The pair attempted to breach the lower bound on several occasions and repeated efforts left the pair exhausted as it stalled and turned lower.
This also appears to have been another attempt for the pair to test the rising trend line from January 2019. After the last failure in February, traders may have simply thrown in the towel right around the same time the pair failed to close above 8.7881.
USD/NOK – Four-Hour Chart
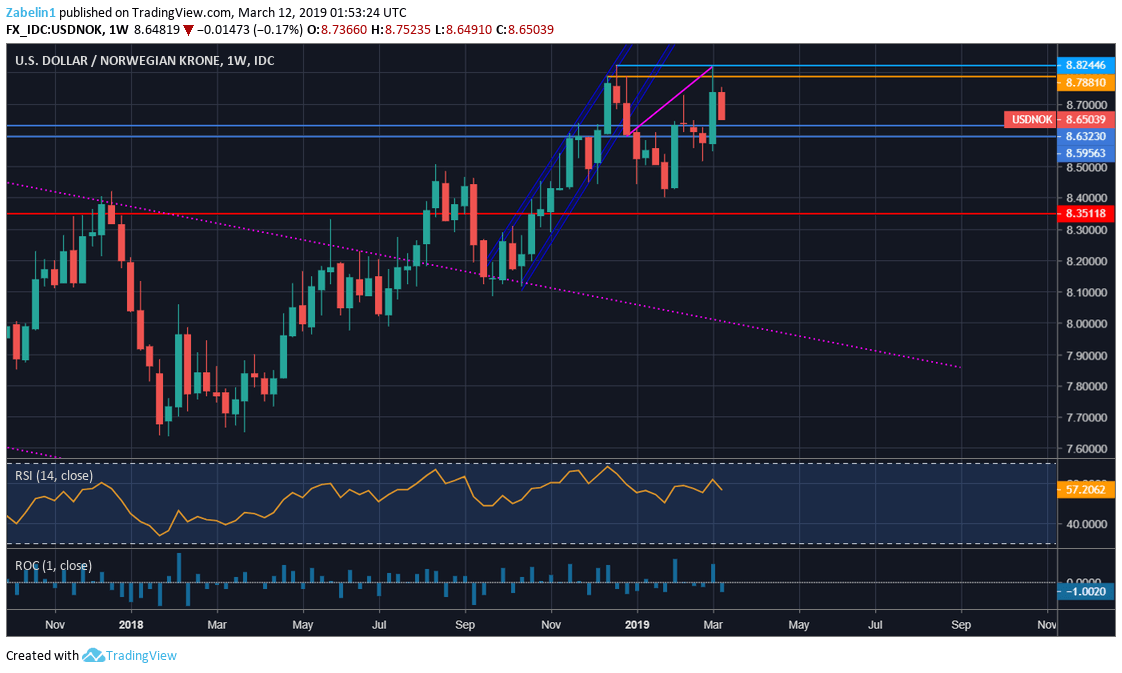
A weekly chart reveals how the pair broke a steep trading channel in December and traded lower for a while. However, now the pair appears to be attempting to regroup and continue the charge upward. The boundary between 8.6323-8.7881 may keep the pair in check for the next few months.
USD/NOK – Weekly Chart
Looking ahead, later today the UK Parliament will be voting on the Prime Minister’s Brexit deal. Preliminary reports and commentary from her Deputy, David Lidington, seemed to be welcomed by the markets. GBP/USD rallied after he reported that the government secured "improved" changes to her divorce deal, perhaps increasing the odds of it passing. However, given how sporadic and volatile Brexit developments are, it is equally likely that whatever occurs it will produce an equally market-moving reaction.
To understand why the Swedish Krona and Norwegian Krone are particularly vulnerable to these kinds of developments, read my weekly Nordic fundamental forecast.
SWEDISH KRONA, NORWEGIAN KRONE TRADING RESOURCES
- Join a free Q&A webinar and have your trading questions answered
- Just getting started? See our beginners’ guide for FX traders
- Having trouble with your strategy? Here’s the #1 mistake that traders make
--- Written by Dimitri Zabelin, Jr Currency Analyst for DailyFX.com
To contact Dimitri, use the comments section below or @ZabelinDimitri on Twitter


