


What traders need to monitor as the year-end nears:
The end of the year is fast approaching and these are some of the themes that financial market traders should keep a close eye on:
- The US-China trade war
- Brexit
- The row between Italy and the EU over the Italian budget and the effect on Italian banks
- Weaker global economic growth and its impact on US interest rates and stocks
- Market volatility
US-China trade war
Above all else, it is probably the US-China trade battle that has dented market sentiment over the last few months and it will likely continue to dominate trading in December and beyond. At present, the spotlight is on a two-day G20 Summit in Argentina that begins on November 30. US President Donald Trump and Chinese President Xi Jinping are due to hold talks but the chances of a de-escalation are slim.
A failure to at least call a ceasefire would likely result in risk aversion remaining the principal driver of asset prices, supporting safe havens such as the Japanese Yen, the Swiss Franc and US Treasuries. The US Dollar has, some would say perversely, also benefited from risk-off trades but given that the US is a combatant JPY and CHF are arguably safer.
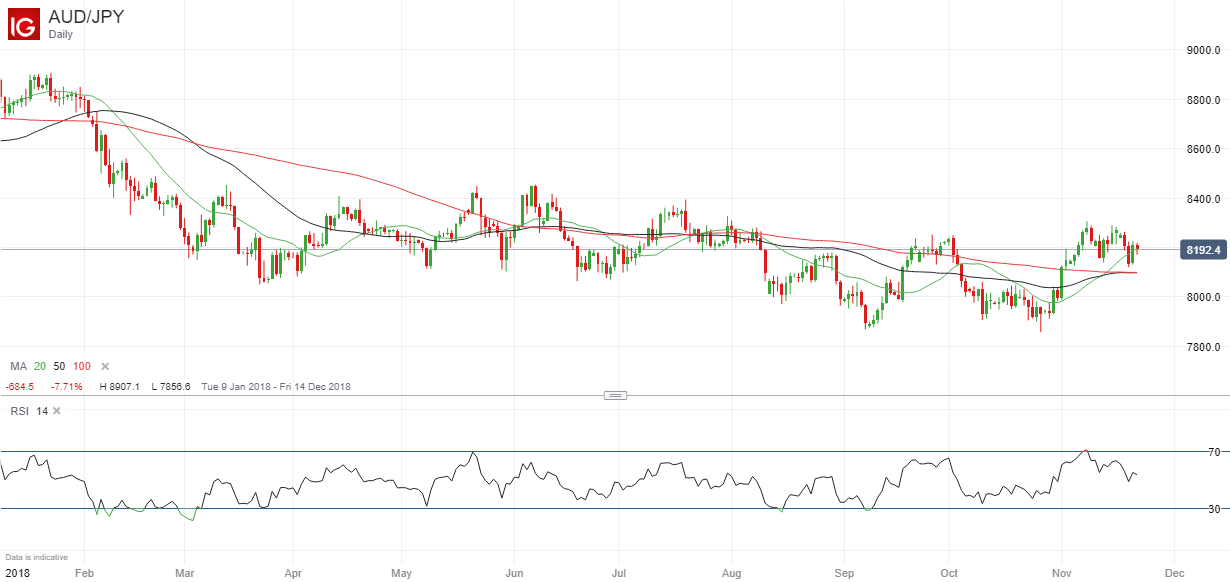
On the other side of the coin, risk-on assets such as stocks and the Australian Dollar could well remain under pressure, extending this year’s decline so far in pairs like AUDJPY.
AUDJPY Price Chart, Daily Timeframe (January 1 – November 22, 2018)
You can click on the chart above or any of the charts below for a high-quality pop-up image
Infographic: A Brief History of Trade Wars
Trade Wars and Tariffs: The Impact on Europe, EUR, GBP and Stocks
Using News and Events to Trade Forex
Brexit and GBP
For the British Pound and other UK assets such as London-listed shares and UK Government bonds (Gilts), Brexit is and will remain the most important factor moving prices. Here the key is whether a deal between the UK and the EU will pass through the UK Parliament, which currently looks unlikely.
That would leave few alternatives to the UK crashing out of the EU on March 29 next year and if that seemed the most-likely outcome GBP would suffer badly. Alternatives include a UK General Election or a second referendum, both of which would create uncertainty and likely dent confidence in GBP too. If, unexpectedly, the deal were approved, a major Sterling rally would follow.
GBPUSD Price Chart, Daily Timeframe (January 1 – November 22, 2018)

Brexit Effect on the Pound and UK Stocks
Infographic: Brexit Timeline – The Path Ahead
Italian Budget row
The EU has now rejected Italy’s expansionary budget plans twice, with the European Commission saying Italy should face disciplinary action after “serious non-compliance” with its fiscal rules. With no end in sight to this spat, the Euro can be expected to suffer downward pressure. There has also been a highly negative impact on Italy’s banks, while Italian government bond yields have risen to near five-year highs – trends that may well continue.
Italy is the Eurozone’s third-largest economy and has the second-largest government debt as a percentage of GDP after Greece. It is therefore highly significant and could potentially prompt a Eurozone crisis, although that remains a distant possibility. Nonetheless, EUR will remain under a cloud until a settlement is reached.
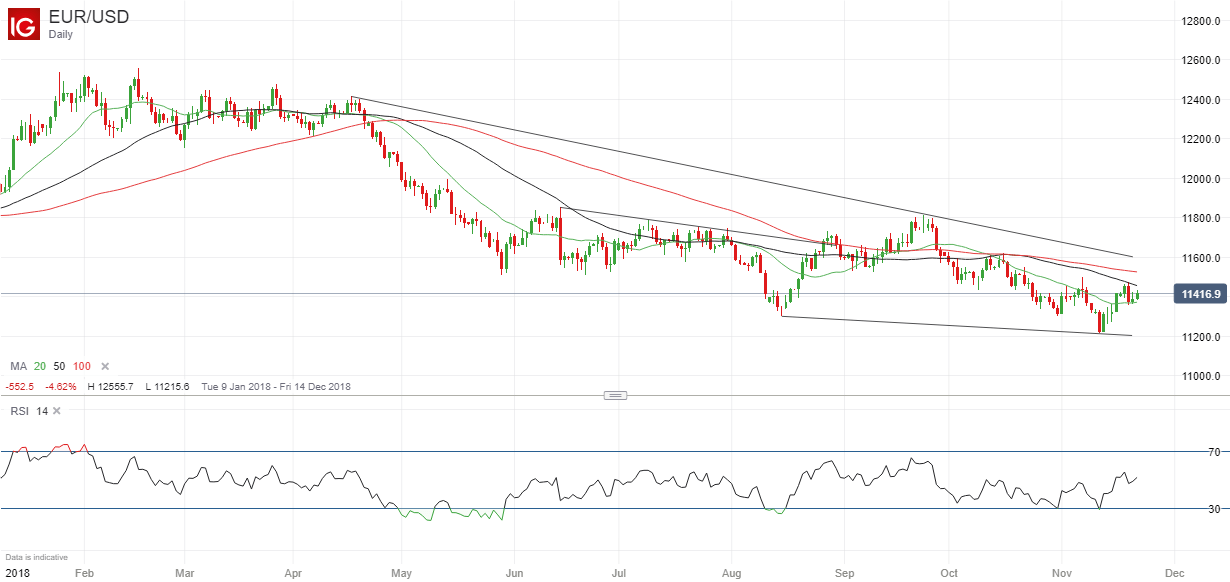
EURUSD Price Chart, Daily Timeframe (January 1 – November 22, 2018)
Infographic: Is the Eurozone Entering a Second Debt Crisis in 2018?
Which Countries Might Want to Leave the EU After Brexit
Global economic growth to weaken
A highly significant report from the Organization for Economic Co-operation and Development, released in November, warned that global economic growth remains strong but has passed its recent peak and faces escalating risks including rising trade tensions and tightening financial conditions. The OECD, a Paris-based think tank, revised down its growth forecasts for next year for most of the world’s major economies and said global GDP is now expected to expand by only 3.5% in 2019, compared with the 3.7% forecast in last May’s Economic Outlook, and by 3.5% in 2020.
This perhaps explains why Wall Street stocks, and particularly technology shares, have been falling – with Apple leading the way down on concern about falling demand for iPhones, and corporate earnings coming in below expectations.
For FX traders, an important possible result of this could be the US Federal Reserve deciding to increase US interest rates at a slower pace next year than previously expected. A quarter-point hike is widely expected this December but if expectations grow that there will be just one more increase next year then the US Dollar can be expected to weaken. The following bar chart shows the probabilities of the Fed funds rate being at various levels at the end of next year.
US interest rate expectations
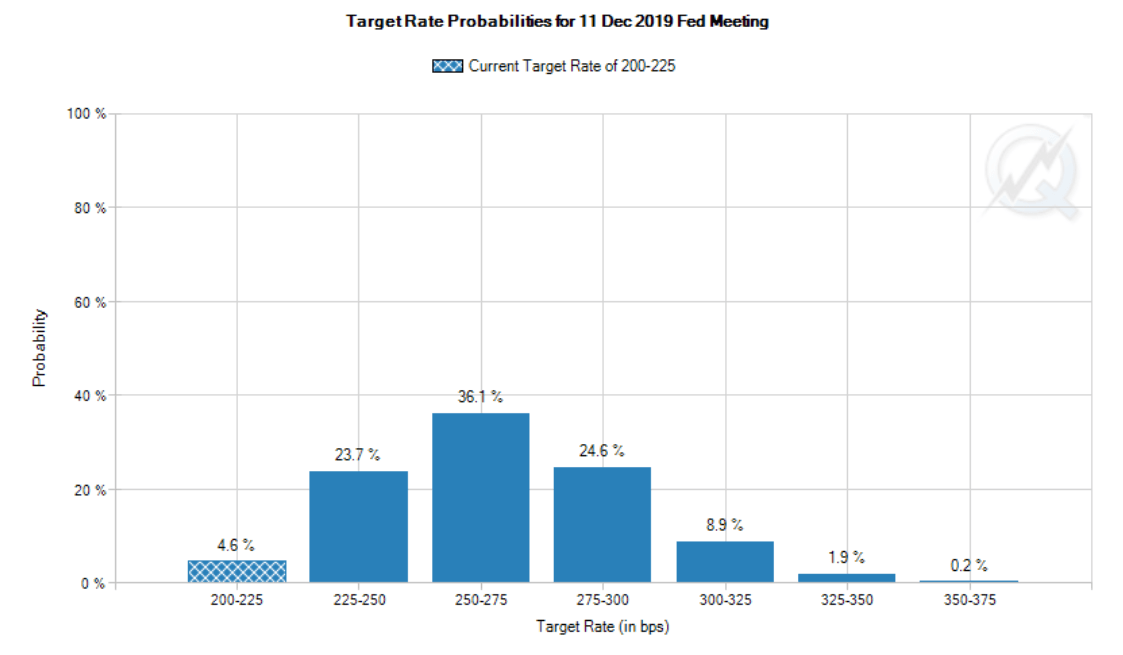
Source: CME FedWatch Tool
US Trade Wars Put Global Economic Growth, Market Stability at Risk
The Impact of Tariffs and Trade Wars on the US Economy and the Dollar
Volatility set to fall
As the end-year holiday period nears, volumes tend to thin and that can lead to both a significant reduction in market volatility and to sharp price movements that can be profitable or can catch traders out – so caution is needed. It is important to remain disciplined and not to let emotion take over from strategy, as DailyFX Chief Currency Strategist John Kicklighter explains here.
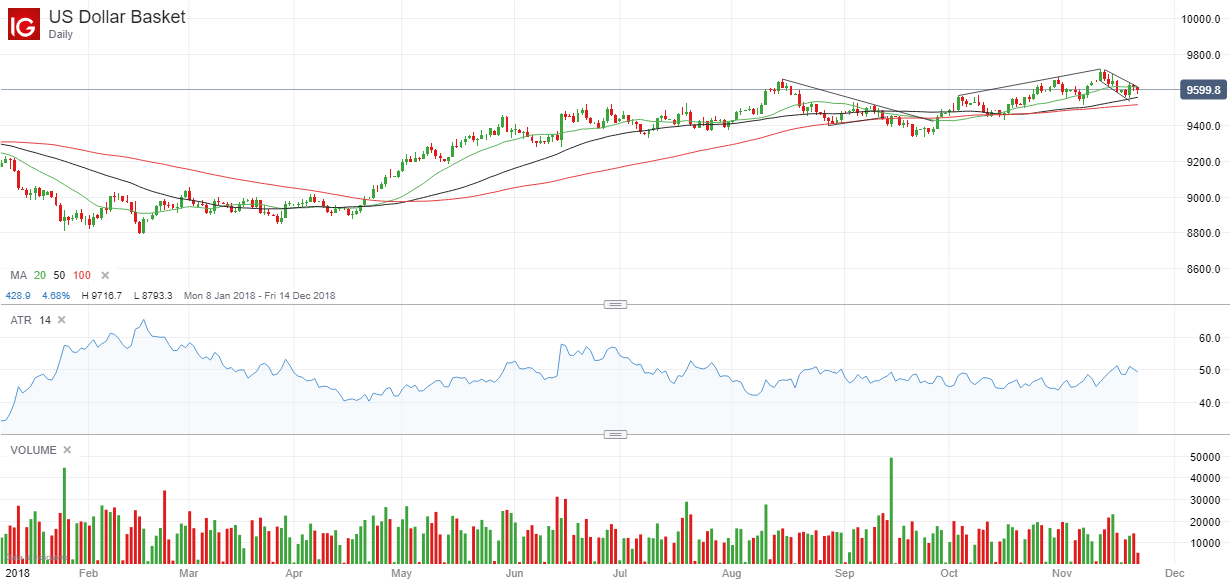
On Wall Street, the best-known measure of volatility is the VIX, commonly known as the stock market fear index. In the FX markets, traders can use the average true range indicator as a measurement of volatility and in the following chart it is shown in blue for the US Dollar Index (DXY) above the bar chart showing that volume is already beginning to tail off.
US Dollar Index Price Chart, Daily Timeframe (January 1 – November 22, 2018)
A Guide to the S&P 500 VIX Index
Resources to help you trade the forex markets
Whether you are a new or an experienced trader, at DailyFX we have many resources to help you:
- Analytical and educational webinars hosted several times per day,
- Trading guides to help you improve your trading performance,
- A guide specifically for those who are new to forex,
- And you can learn how to trade like an expert by reading our guide to the Traits of Successful Traders.
--- Written by Martin Essex, Analyst and Editor
Feel free to contact me via the comments section below, via email at martin.essex@ig.com or on Twitter @MartinSEssex


