


- Bitcoin stuck in a rut.
- Ethereum weekly losses exceed 20%
Looking for fresh trading ideas? - Get your free DailyFX Third-Quarter Trading Forecast and Trading Guide here.
After a tough week in the cryptocurrency space with all major digital currencies registering a negative performance, market heavyweight BTC has stabilized and may be looking to re-coup some of its losses.
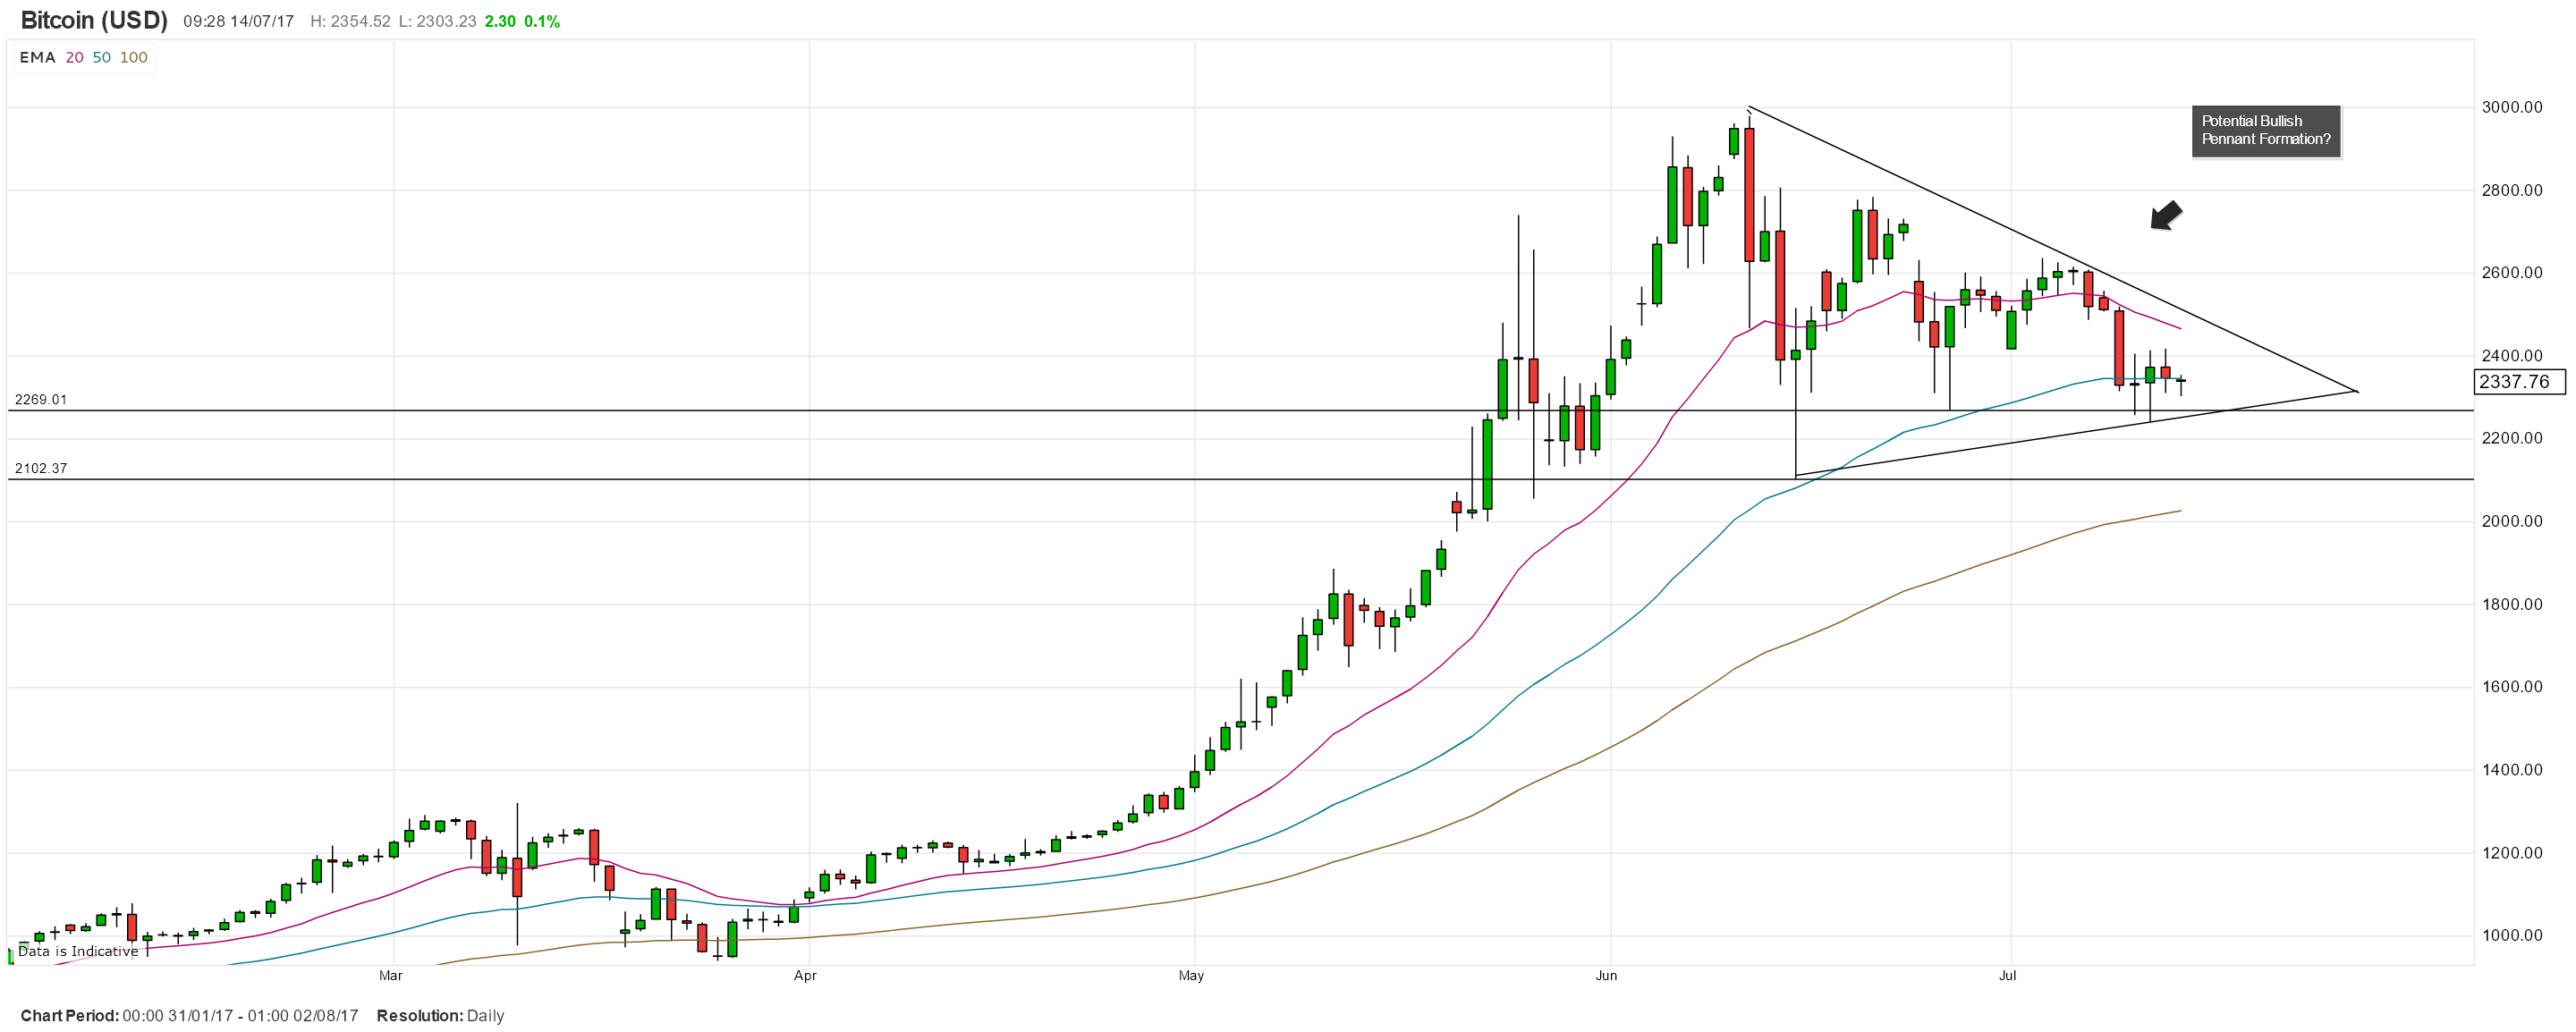
A look at the daily chart shows a potential bullish pennant formation, although the lower-high/higher-low pattern normally seen is not quite so distinct.
Chart: Bitcoin Daily Timeframe (February - July 14, 2017)
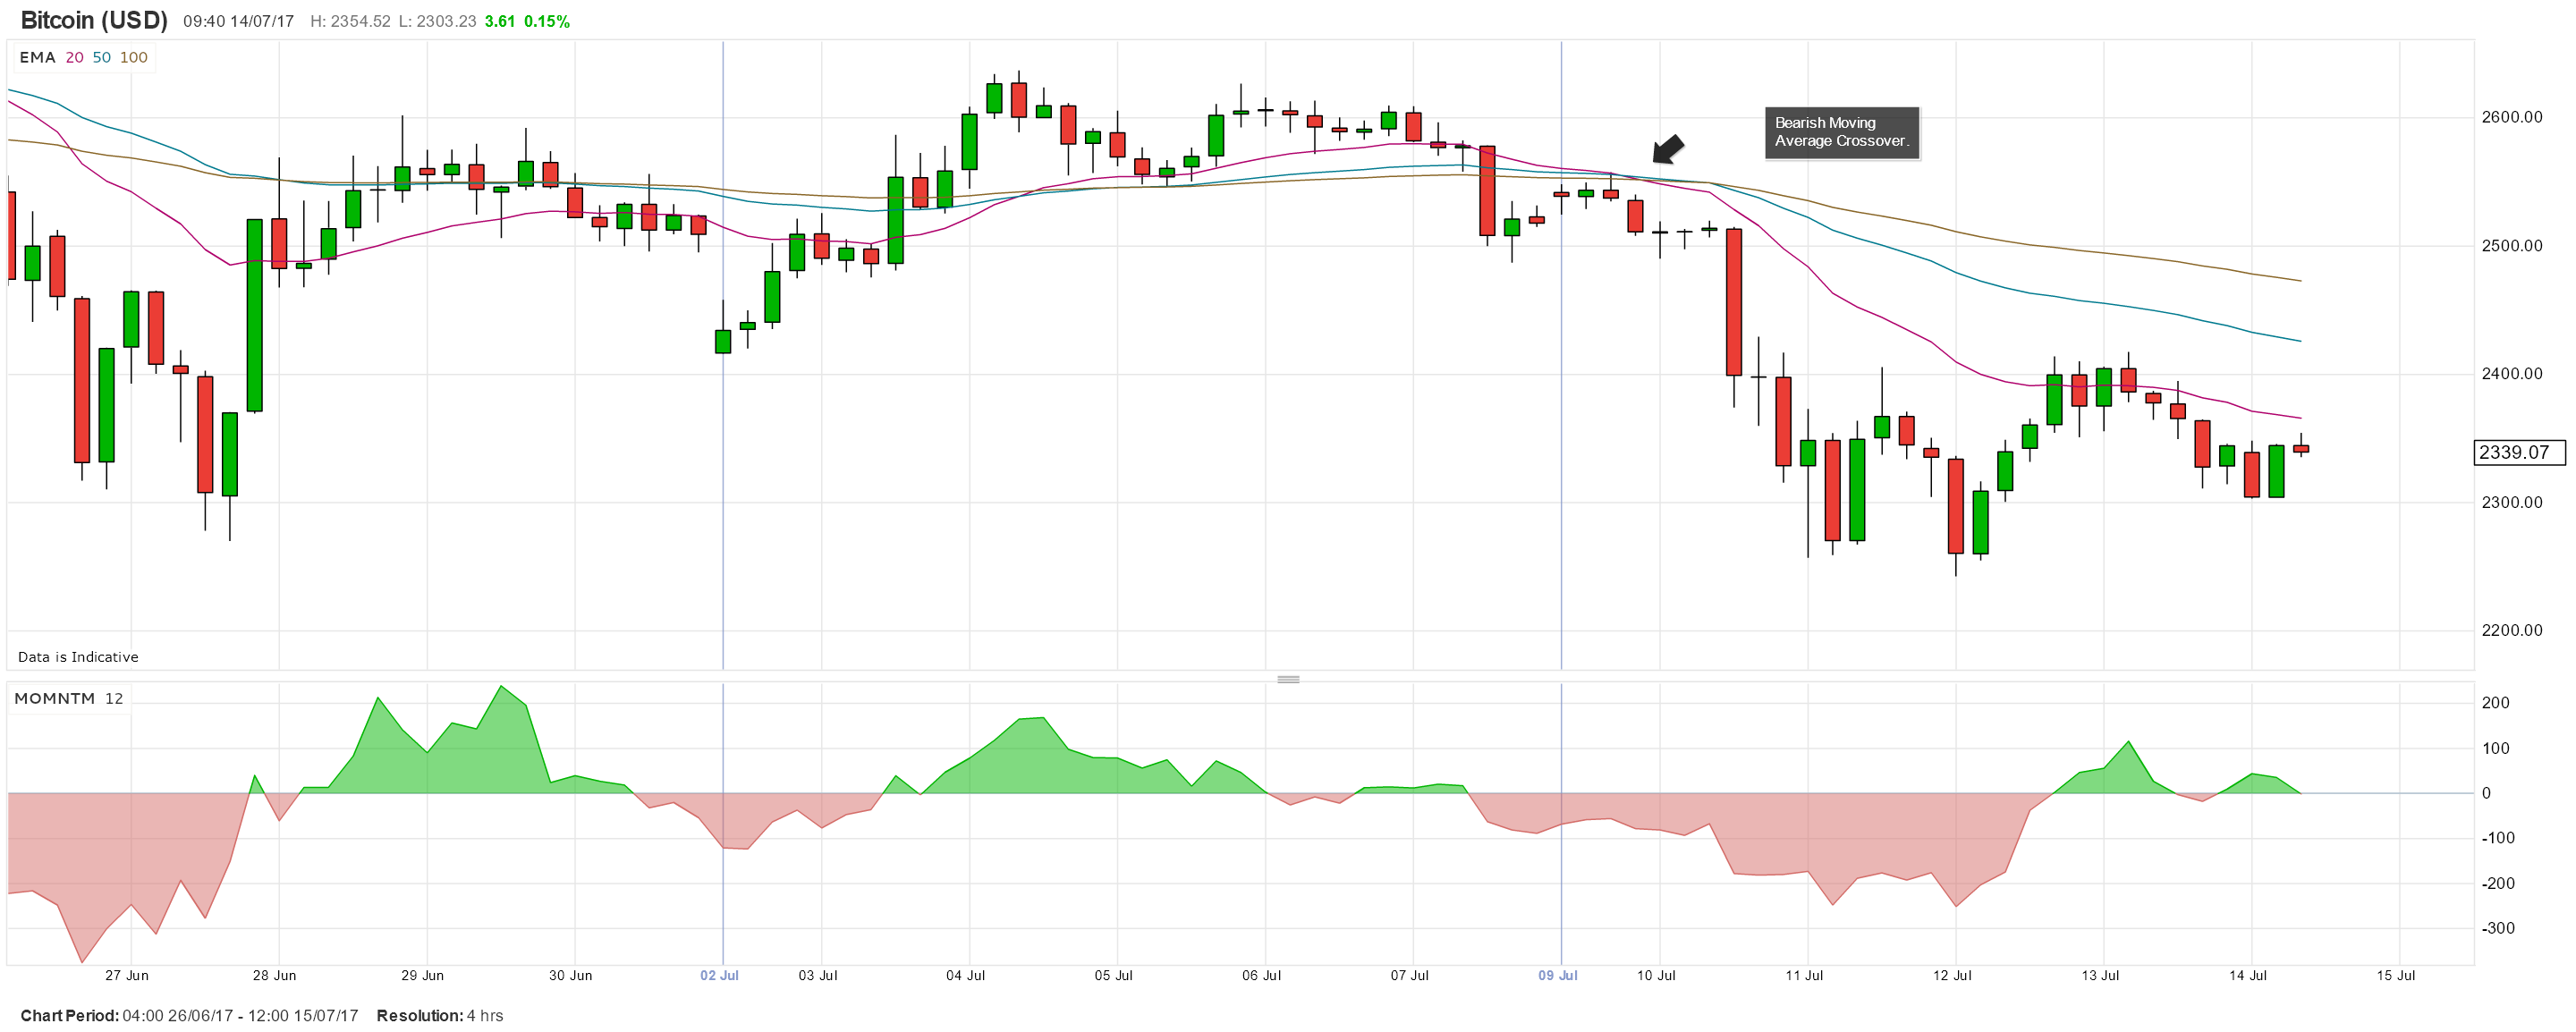
The four-hour chart however signals a potential for BTC to move even lower as the recent downturn has seen the currency move below its 20-, 50- and 100-day exponential moving averages (ema). The break lower was confirmed on July 9 with a bearish crossover with the 20- and 50-day ema below the 100-day ema. The momentum indicator also has moved from positive to neutral.
Chart: Bitcoin Four-Hour Timeframe (June 26 – July 14, 2017)
The second-largest digital currency Ethereum (ETH) has also suffered heavy losses this week, falling by around 20%. With most explanations of this week’s fall based on personal opinion rather than market specifics or technical releases, ETC may be in for a continued rough ride in the weeks ahead.
Chart: Ethereum Five Day Chart (July 10-14, 2017)
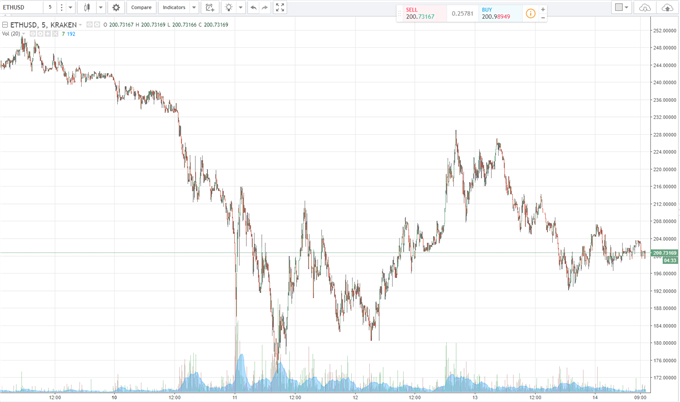
Chart by TradingView.
Market Moves/Capitalizations – July 14, 2017.
| Cryptocurrency | Price/Change% | Market Cap |
|---|---|---|
| BITCOIN | $2360 -1.24% | $38.820bn |
| ETHEREUM | $206.1 -4.10% | $19.22bn |
| RIPPLE | $0.197 -2.84% | $7.558bn |
| LITECOIN | $46.18 -1.14% | $2.400bn |
| ETHEREUM CLASSIC | $18.48 +0.36% | $1.728bn |
If you are interested in trading, please check out next week’s free webinars where our analysts discuss a wide range of technical analysis, charts, trade set-ups and sentiment across a range of assets.
--- Written by Nick Cawley, Analyst
To contact Nick, email him at nicholas.cawley@ig.com
Don't trade FX but want to learn more? Read the DailyFX Trading Guides


