


NASDAQ 100 OUTLOOK:
- Nasdaq 100 falls for the second day in a row ahead of the FOMC decision
- Rising inflationary pressures and recent Fed comments suggest the U.S. central bank could move to accelerate the process of monetary policy normalization
- In this article we analyze the most relevant technical levels for the Nasdaq 100
Trade Smarter - Sign up for the DailyFX Newsletter
Receive timely and compelling market commentary from the DailyFX team
Most read: S&P 500, Nasdaq Snap Back Ahead of the Fed - Is a Major Sell-Off Nearby?
U.S. stocks extended losses Tuesday on market apprehension amid rising Treasury yields ahead of the FOMC decision on Wednesday afternoon. At the market close, the Nasdaq 100 tumbled 1.04% to 15,915, its lowest level since December 6th amid broad-based big-tech softness.
Although uncertainty about the omicron variant weighed on sentiment, expectations that the Fed could move to expedite the withdrawal of the easy money policies that have helped fuel the multi-year stock market rally were the main driver of the sell-off.
The U.S. central bank will conclude its last monetary policy conclave of the year tomorrow. Although the overnight rate is expected to remain unchanged at its current range of 0.00% to 0.25%, the institution led by Jerome Powell may announce a plan to accelerate the bond-buying tapering scheme in an effort to curb inflation, hovering at a four-decade high of 6.8% y/y.
November PPI data released this morning, which showed wholesale prices grew at the fastest pace on record since the annual series was first launched in 2010, appears to have reinforced the narrative that the Fed will come out swinging and adopt a hawkish stance at the end of its two-day gathering. Opinions differ on Wall Street, but most analysts believe the Fed will double the pace of tapering to $30 billion, ending the program in March, three months earlier than originally planned.
A faster wind-down of asset purchases will bring forward the liftoff timetable, opening the door to multiple rate increases in 2022, perhaps two or even three from half a hike envisioned at the September meeting according to the median forecast.

Recent guidance has been minimal, but the updated dot plot should offer valuable new information on whether the normalization cycle will be shallow or aggressive. Powell's decision to retire the "transitory" language when describing inflation suggests that the Fed is becoming increasingly uncomfortable with soaring consumer prices, so traders should prepare for the possibility of a hawkish shift.
If policymakers pencil in more than two rate hikes for 2022, the equity market could take a hit, with technology and unprofitable growth stocks being the most exposed. A steep tightening path over the forecast horizon could lead investors to argue that the central bank is making a policy mistake just as growth is slowing, a bad outcome for risk assets that have become so dependent on excess liquidity and cheap credit.
In summary, volatility will remain elevated across asset classes and stocks are likely to be slightly biased to the downside heading into year-end. As a result, the tech-heavy Nasdaq 100, companies with lofty valuations and the most speculative corners of the market could be vulnerable to a larger pullback in the very near term.

NASDAQ 100 TECHNICAL ANALYSIS
After failing to clear horizontal resistance in the 16,400 area, the Nasdaq 100 has pulled back this week, falling briefly to trendline support at 15,700. If this technical floor fails to hold, we could see a move towards 15,500, before sellers target the 15,200 area.
On the flip side, if dip buyers resurface and the index pivots higher, resistance appears at 16,400, but a move above this barrier could accelerate the recovery and pave the way for a retest of the all-time high near 16,765.
NASDAQ 100 TECHNICAL CHART
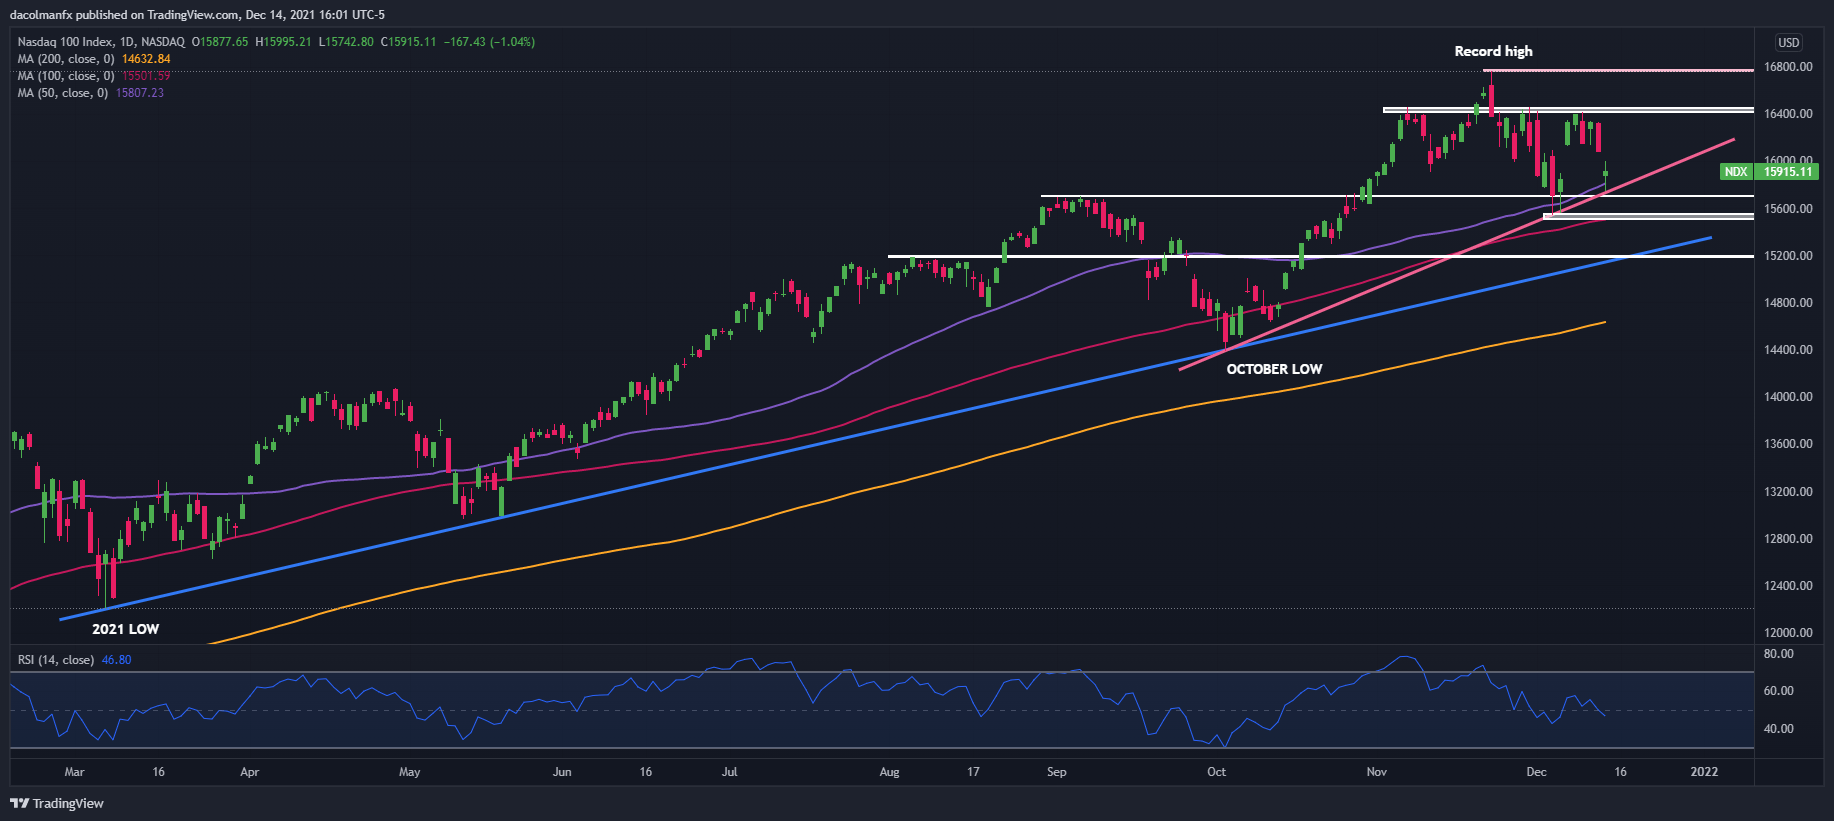
Nasdaq 100 (NDX) chart prepared in TradingView
EDUCATION TOOLS FOR TRADERS
- Are you just getting started? Download the beginners’ guide for FX traders
- Would you like to know more about your trading personality? Take the DailyFX quiz and find out
- IG's client positioning data provides valuable information on market sentiment. Get your free guide on how to use this powerful trading indicator here.
--- Written by Diego Colman, Contributor


