


S&P 500 OUTLOOK:
- S&P 500 retreats from record levels as price fails to push higher and break through technical resistance
- Profit-taking ahead of Wednesday's U.S. CPI data appears to be partially responsible for the pullback
- Elsewhere, PayPal plunges more than 10% after mixed quarterly results and worse-than-expected profit guidance
Trade Smarter - Sign up for the DailyFX Newsletter
Receive timely and compelling market commentary from the DailyFX team
Most read: Top 10 Candlestick Patterns to Trade the Markets
U.S. stocks took a breather on Tuesday and suffered moderate losses as traders became wary of the relentless rally in risk assets witnessed in recent weeks and began taking some profits on fears of a possible correction ahead of U.S. inflation data on Wednesday.
At the market close, the S&P 500 fell 0.35% to 4,685, ending an eight-day winning streak that has seen the index post its 64th record close of the year in the previous session. For its part, the Nasdaq 100 declined 0.77% to 16,210, weighed down by the sharp drop in Tesla and PayPal shares.
PayPal was one of the biggest laggards among mega-caps, tumbling more than 10% intraday after the company missed quarterly top-line forecasts and offered a lackluster outlook for both Q4 and 2022 due to supply chain issues, concerns about the economy and changing spending habits. On the latter point, the payments giant said revenue for next year will rise 18% on sales of $30 billion, notably below the 23% increase anticipated by Wall Street.

With the earnings season winding down, investors' attention will turn to incoming economic data to gauge the strength of the recovery and assess the trend in consumer prices. In this regard, the U.S. CPI release on Wednesday will be a key data metric to monitor. October headline inflation is expected to spike 5.8% y/y, while the core indicatoris seen jumping 4.3% y/y, but traders should brace for an upside surprise amid persistent supply chain bottlenecks and elevated energy prices.
Higher-than-expected inflation figures can be detrimental for stocks, as they can dampen confidence and bring forward interest rate liftoff bets, despite the dovish rhetoric embraced by the Federal Reserve. The opposite is also true: lower-than-expected CPI numbersfor October can have a positive effect on investors’ mood and boost bullish sentiment, lifting risk-assets across the board.
| Change in | Longs | Shorts | OI |
| Daily | -7% | 2% | -2% |
| Weekly | -10% | 1% | -4% |
S&P 500 TECHNICAL ANALYSIS
S&P 500 was rejected at resistance and pivoted lower on Tuesday amid fading bullish momentum in a context of overbought dynamics as reflected by the RSI oscillator (for reference, the benchmark has risen on 17 of the last 20 trading sessions, a clear sign of market exuberance and too much speculation).
If selling pressure picks up traction, the first technical support to consider appears near the midpoint of a short-term ascending channel at 4,600, but a move below this floor could trigger a pullback towards 4,550. On the flip side, if dip buyers resurface and take control of the market, cluster resistance stands near 4,720. If bulls manage to push price above this barrier, we would be in uncharted territory, but a possible upside target can be seen near the 4,800 psychological level.
S&P 500 TECHNICAL CHART
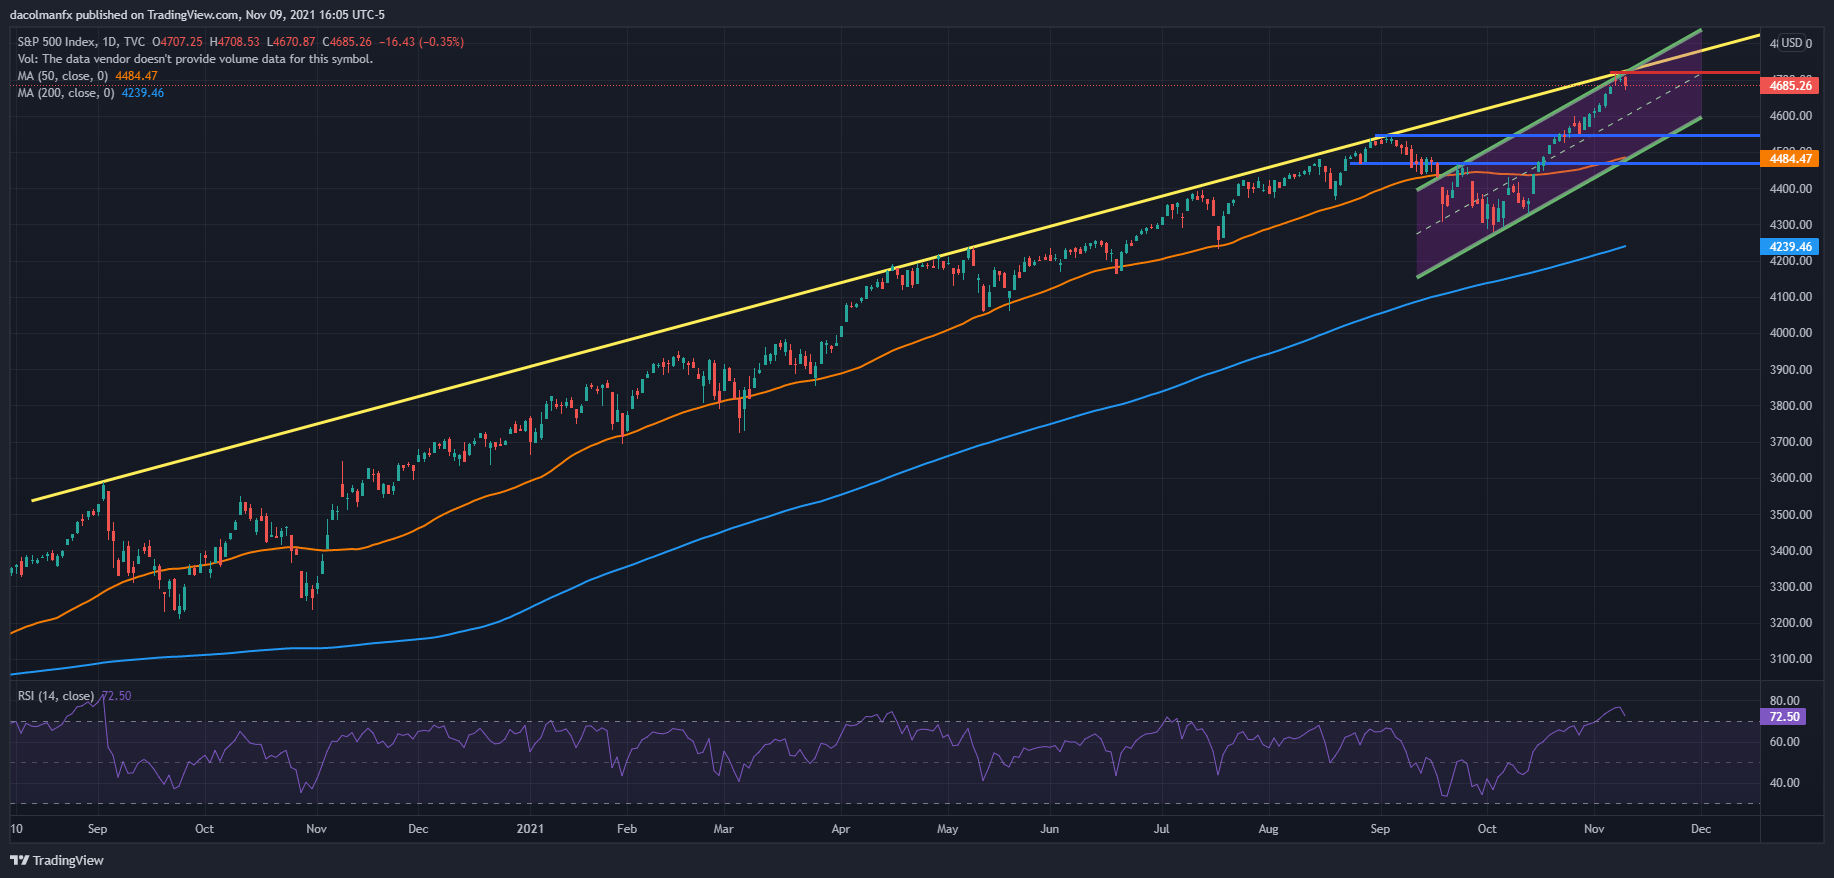
S&P 500 (SPX) Chart by TradingView
EDUCATION TOOLS FOR TRADERS
- Are you just getting started? Download the beginners’ guide for FX traders
- Would you like to know more about your trading personality? Take the DailyFX quiz and find out
- IG's client positioning data provides valuable information on market sentiment. Get your free guide on how to use this powerful trading indicator here.
--- Written by Diego Colman, Contributor


