


British Pound, GBP, GBP/USD, GBP/JPY Price Analysis
- The British Pound has shown strength so far this week against both the US Dollar and the Japanese Yen.
- This comes at odds with a record drop in GDP from yesterday’s data release.
- GBP/USD tested a key zone of confluent support earlier this week, at which point buyers showed up to push the pair higher. GBP/JPY had a similar support test last week around 137.75, which has so far extended through this week as the pair has powered up for a test of the 140.00 psychological level.
- Psychological levels can produce inflections in markets, particularly when they’re re-engaged with for the first time in a while. Learn more about this with DailyFX Education.
GBP/USD Perks Up After Support Test
It’s so far been a week of strength for the British Pound; and considering yesterday’s GDP release, that may come as a surprise. Last quarter saw a record drop in GDP for the UK but that’s appeared to matter little in both GBP/USD and GBP/JPY; both of which have continued bullish short-term themes around that release. Perhaps obscuring that data point are bigger-picture macro themes that have helped to drive weakness both in the US Dollar and the Yen.

I had looked at the topside of GBP/USD earlier this week as one of the mannerisms for following USD-weakness. This look was underpinned by numerous support tests at a key area on the chart, straddling the 1.3000 psychological level. That support zone came into play yesterday and helped to hold the lows for the bulk of the US session; with buyers soon showing up around the US close to push prices back-above the 1.3100 handle.
GBP/USD Four-Hour Price Chart

Chart prepared by James Stanley; GBPUSD on Tradingview
Taking a step back to the daily chart highlights what may be troublesome for bulls. Price action has so far in August appeared very reticent to re-test the March high, which comes in right at the 1.3200 handle. This has helped to produce a middling range so far in the month of August (grey box, below chart). This, coupled with an overbought RSI reading moving back-down and through the 70 level may produce a difficult backdrop for topside continuation.
GBP/USD Daily Price Chart

Chart prepared by James Stanley; GBPUSD on Tradingview
GBP/JPY Overbought and Testing 140
Speaking of RSI, the indicator is at its most overbought on the daily chart of GBP/JPY since December of last year. That’s right around the time that the pair topped-out around the 148 level before giving back almost 2500 pips over the next few months. The third quarter has been especially boisterous for bulls as the pair has surged from the 132 area all-the-way up to the 140’s, which started to come into play this week.
| Change in | Longs | Shorts | OI |
| Daily | 1% | -3% | -1% |
| Weekly | 13% | -31% | -17% |
GBP/JPY Daily Price Chart
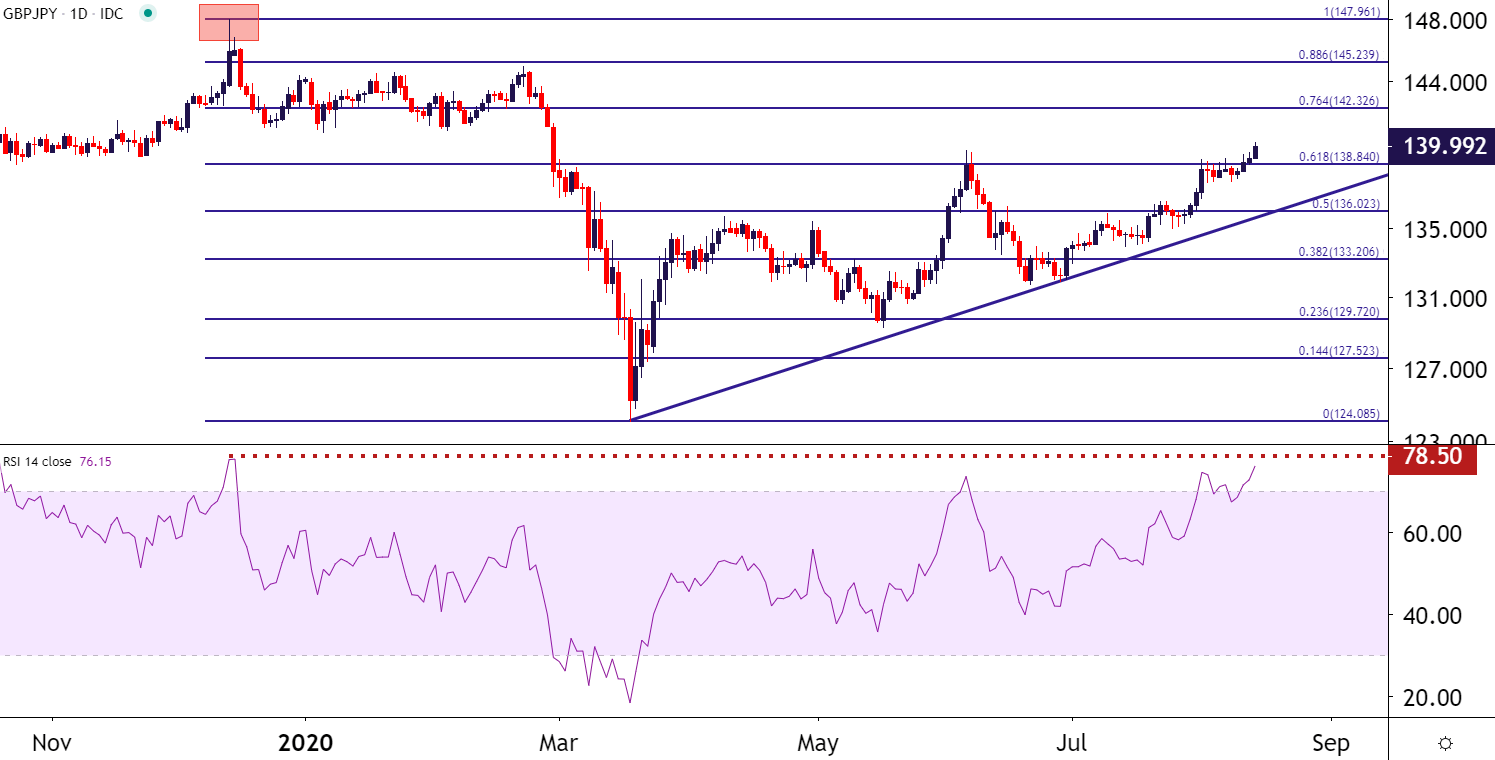
Chart prepared by James Stanley; GBPJPY on Tradingview
Going down to the hourly chart highlights just how contentious that test around 140.00 has been. And this, combined with that massively overbought RSI read from the daily chart can keep the door open for pullback/reversal potential going into the end of the week.

For those that are looking at bullish continuation scenarios, there are a couple of spots of potential support. Below is a zone of prior price action swings that straddles the 139.50 area, and a big lower is the 61.8% Fibonacci retracement of that December-March major move, plotted around the 138.84 area on the chart.
GBP/JPY Hourly Price Chart
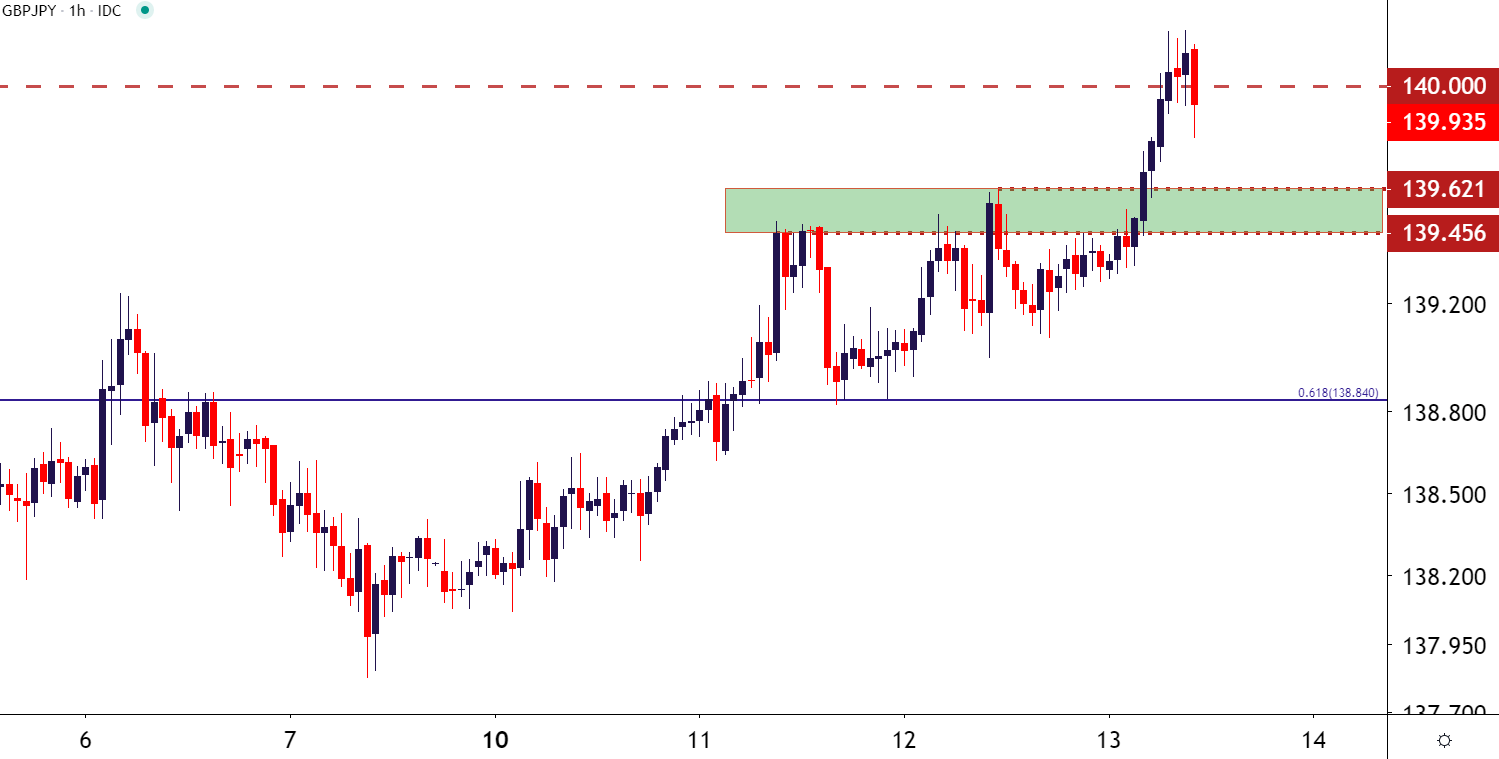
Chart prepared by James Stanley; GBPJPY on Tradingview
--- Written by James Stanley, Strategist for DailyFX.com
Contact and follow James on Twitter: @JStanleyFX


