WTI Crude Oil Talking Points:
- Crude oil prices put in an aggressive sell-off of almost 20% from mid-September into early-October.
- A support zone that’s held the lows for the past four months has come back into play and has presently helped to stem the bleeding. But, can it hold?
- DailyFX Forecasts are published on a variety of markets such as Gold, the US Dollar or the Euro and are available from the DailyFX Trading Guides page. If you’re looking to improve your trading approach, check out Traits of Successful Traders. And if you’re looking for an introductory primer to the Forex market, check out our New to FX Guide.
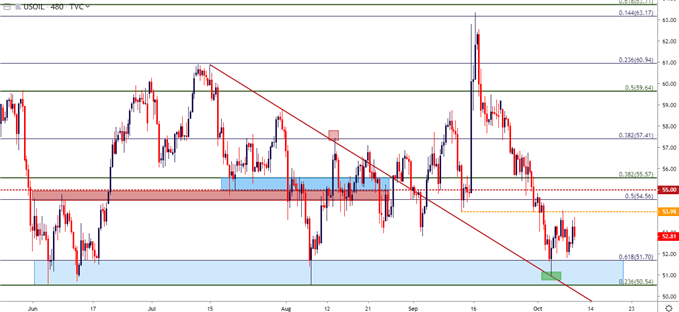
Crude oil prices have been mired by a brutal sell-off over the past few weeks. After an initial flare of strength following the drone attack in Saudi Arabia earlier in September, resistance caught mid-month and sellers drove for the next three weeks to produce a peak-to-trough move of more than 19%.
Early-October finally produced a bit of respite in that theme after a big zone of long-term support came into play. My colleague Michael Boutros discussed this yesterday in the article entitled, Oil Price Outlook: Crude Collapses into Critical Support. That zone has now held support for a nearly a week after first being re-encroached upon last Thursday.
WTI Crude Oil Eight Hour Price Chart

Chart prepared by James Stanley; Crude Oil on Tradingview
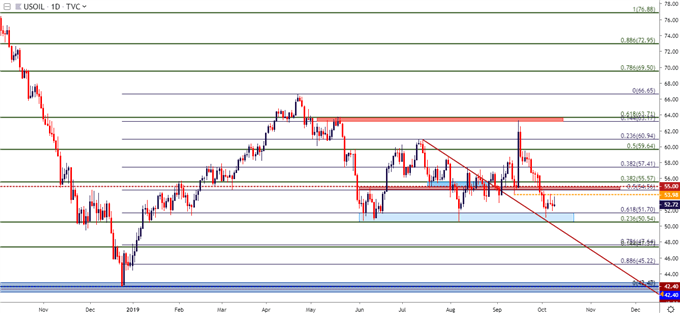
Taking a step back to look at the big picture, the big question is whether sellers can continue to push. The zone of support that’s currently helping to hold the lows has now been tested twice over the past four months, each time with buyers showing up to provoke a topside bounce. This zone is comprised of two different Fibonacci levels: The 23.6% retracement of last year’s Q4 sell-off is at 50.54, while the 61.8% retracement of the December, 2018 – April, 2019 major move lurks is at 51.70.
The two prior suppor tests came amidst similar backdrops, when one-sided trends were running aggressively-lower, in early-June and again in early-August.
WTI Crude Oil Daily Price Chart

Chart prepared by James Stanley; Crude Oil on Tradingview
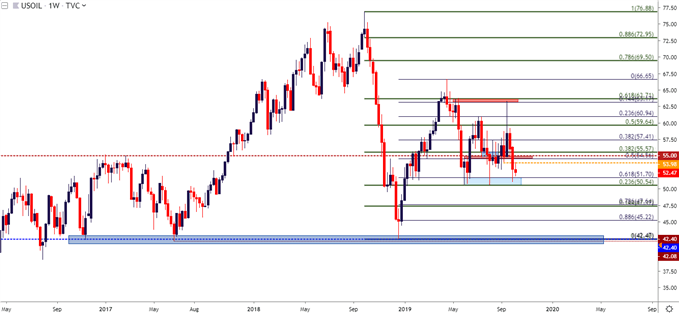
And taking an even further step back, another big support zone remains of interest and that’s the area that’s held the three-year-lows. This comes in around the 42-handle and was last in-play in December of 2018 after the brutal Q4 sell-off. That was the third separate test of that support after it had similarly helped to craft lows in late-2016 and again in 2017; followed by the next test in Q4 of last year after what had become a brutal three-month-selloff.
WTI Crude Oil Weekly Price Chart

Chart prepared by James Stanley; Crude Oil on Tradingview
Crude Oil Strategy Moving Forward
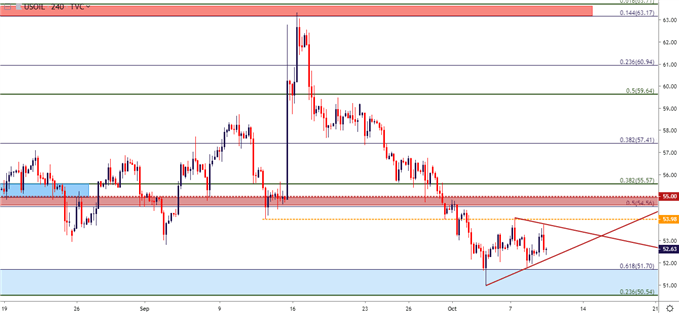
From the above two longer-term charts, the big item of interest is on the downside, looking for breaches of support at 50.54 and, from a longer-term view 42 to open the door for deeper bearish moves. At this point, sellers may not yet be ready to pose a break as indicated by the waning bearish drive since last week’s re-test. So that bearish theme may not yet be ready for continuation.
But, for traders looking to take on short-side exposure, near-term resistance potential around 54.46-55.00 zone could quickly re-open that door. Alternatively, should bears show little patience and pose a push-lower in the near-term, breakout logic could be incorporated on pushes below the 50-handle, looking for moves down towards longer-term supports around 47.50. Secondary target potential remains around 45.00 followed by that big-picture support looked at on the weekly chart above, taken from 42-42.40.
WTI Crude Oil Four-Hour Price Chart

Chart prepared by James Stanley; Crude Oil on Tradingview
To read more:
Are you looking for longer-term analysis on the U.S. Dollar? Our DailyFX Forecasts have a section for each major currency, and we also offer a plethora of resources on Gold or USD-pairs such as EUR/USD, GBP/USD, USD/JPY, AUD/USD. Traders can also stay up with near-term positioning via our IG Client Sentiment Indicator.
Forex Trading Resources
DailyFX offers an abundance of tools, indicators and resources to help traders. For those looking for trading ideas, our IG Client Sentiment shows the positioning of retail traders with actual live trades and positions. Our trading guides bring our DailyFX Quarterly Forecasts and our Top Trading Opportunities; and our real-time news feed has intra-day interactions from the DailyFX team. And if you’re looking for real-time analysis, our DailyFX Webinars offer numerous sessions each week in which you can see how and why we’re looking at what we’re looking at.
If you’re looking for educational information, our New to FX guide is there to help new(er) traders while our Traits of Successful Traders research is built to help sharpen the skill set by focusing on risk and trade management.
--- Written by James Stanley, Strategist for DailyFX.com
Contact and follow James on Twitter: @JStanleyFX


