


Gold (XAU) Price, Silver (XAG) Price Analysis and Chart
- Gold rallies back over $1,500/oz. on safe-haven buying.
- Silver lags gold for now but eyes $18.00/oz. again.
Q3 2019 Gold Forecast and Top Trading Opportunities
Gold Boosted by Traditional Safe-Haven Bid
News that Saudi oil fields had been attacked by drones on Saturday - with Iran being heavily implicated – sent gold higher at the start of the week and back above $1,500/oz. Gold’s safe-haven appeal saw buyers return after President Trump warned Iran, who the US blame for the attack, that they were ‘locked and loaded’ while Iran warned the US that they were ‘ready for a fully-fledged war’. Tensions in the region were already high over the collapse of the Tehran nuclear deal, and this recent attack is likely to keep gold bid in the short- to medium-term.
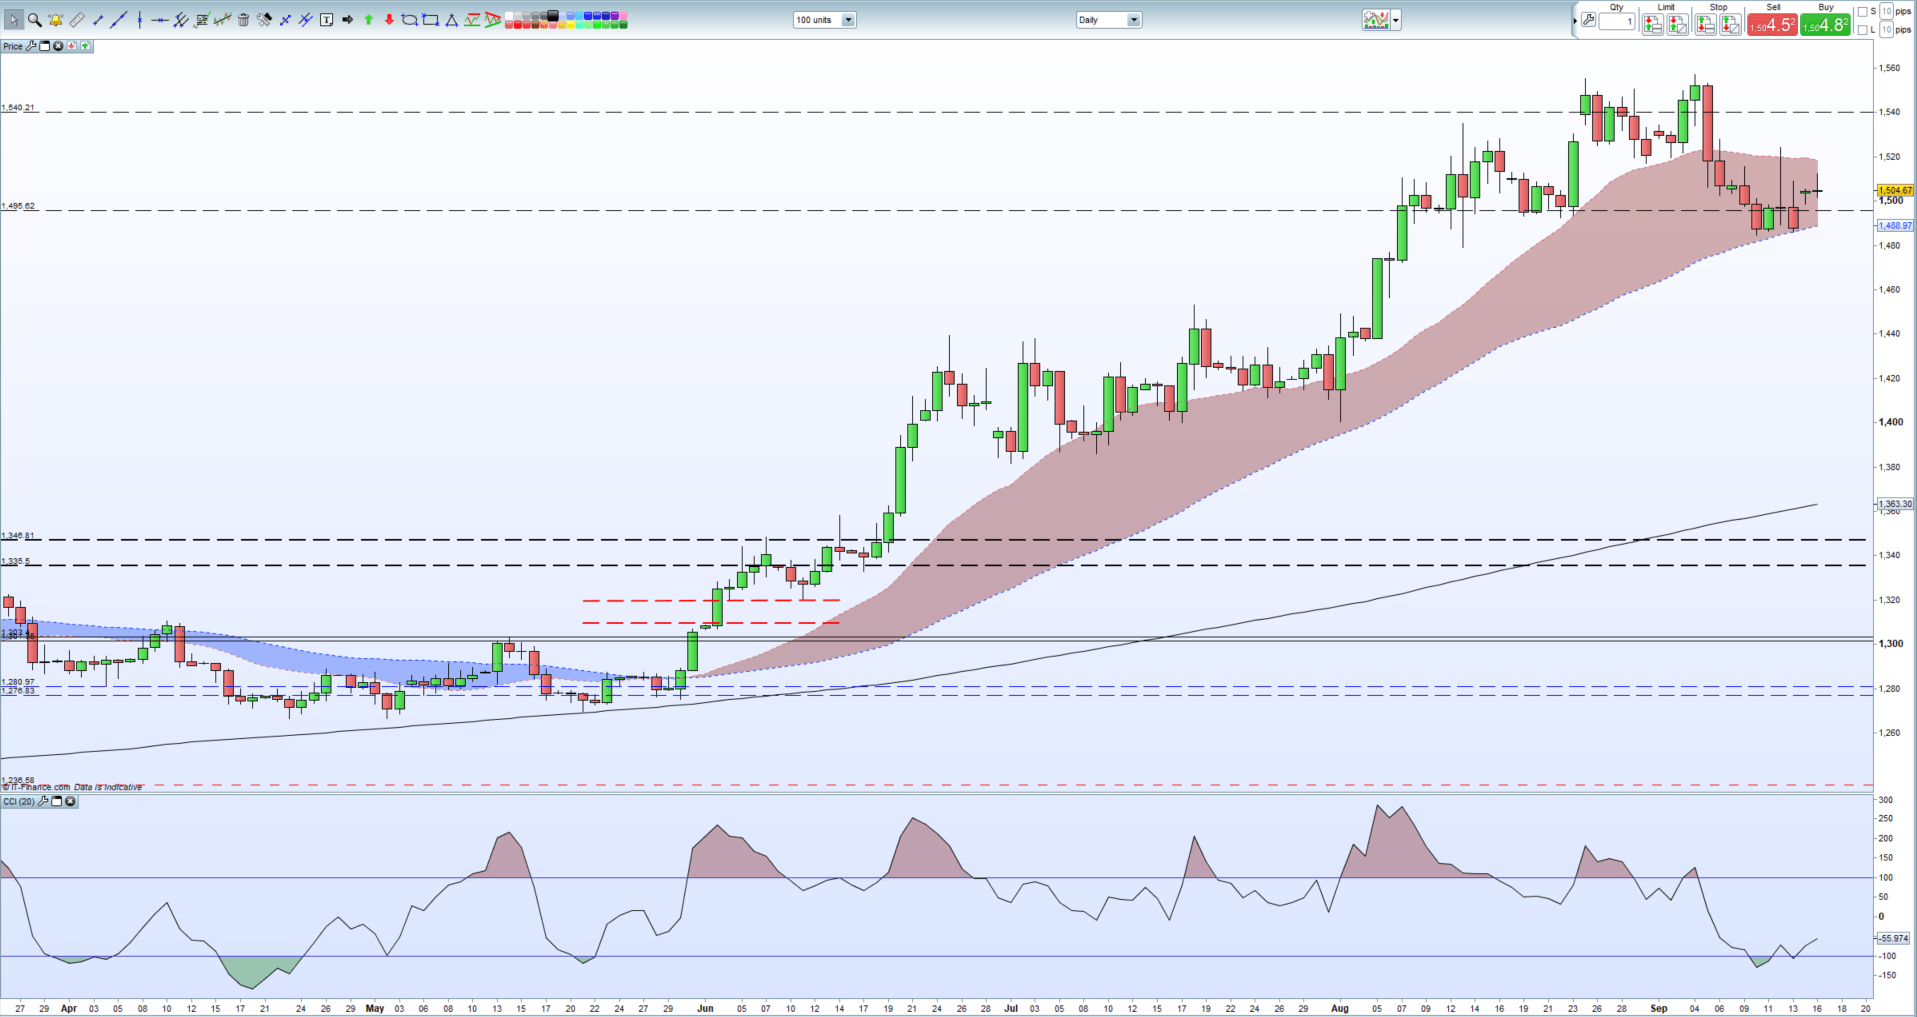
Having traded around $1,512/oz., the precious metal has dipped back to $1,504/oz. and should remain bid around these levels going into this week’s main event, the FOMC meeting this Wednesday. The Fed is fully expected to cut interest rates again by 25 basis points and the post-FOMC press conference will see the central bank give further clues to the strength of the US economy.
Gold is likely to re-test recent highs between $1,515/oz. and $1,528/oz ahead of the Fed but is unlikely to break higher until Fed chair Powell has spoken. To the downside there is strong support around $1,484/oz. and this is unlikely to come under pressure if US-Iran tensions remain.
Gold Price Daily Chart (March – September 16, 2019)
IG Client Sentiment data show that 71.7% of retail traders are net-long of gold, a bearish contrarian indicator. However, recent daily and weekly positional changes give us a stronger bearish contrarian trading bias.
How to Trade Gold: Top Gold Trading Strategies and Tips
Silver Turns Higher
Silver followed gold higher at the open and looks to re-claim $18.00/oz. in the short-term before the September 12 high at $18,47/oz. comes into view. To the downside, the $17.42 - $17.52/oz. area should provide a decent level of support. The gold/silver ratio is currently 84.00 after having tightened to around 82.00 last week.
Silver Daily Price Chart (January – September 16, 2019)

How to Trade Silver: Top Trading Strategies
Traders may be interested in two of our trading guides – Traits of Successful Traders and Top Trading Lessons – while technical analysts are likely to be interested in our latest Elliott Wave Guide.
What is your view on Gold and Silver – bullish or bearish?? You can let us know via the form at the end of this piece or you can contact the author at nicholas.cawley@ig.com or via Twitter @nickcawley1.


